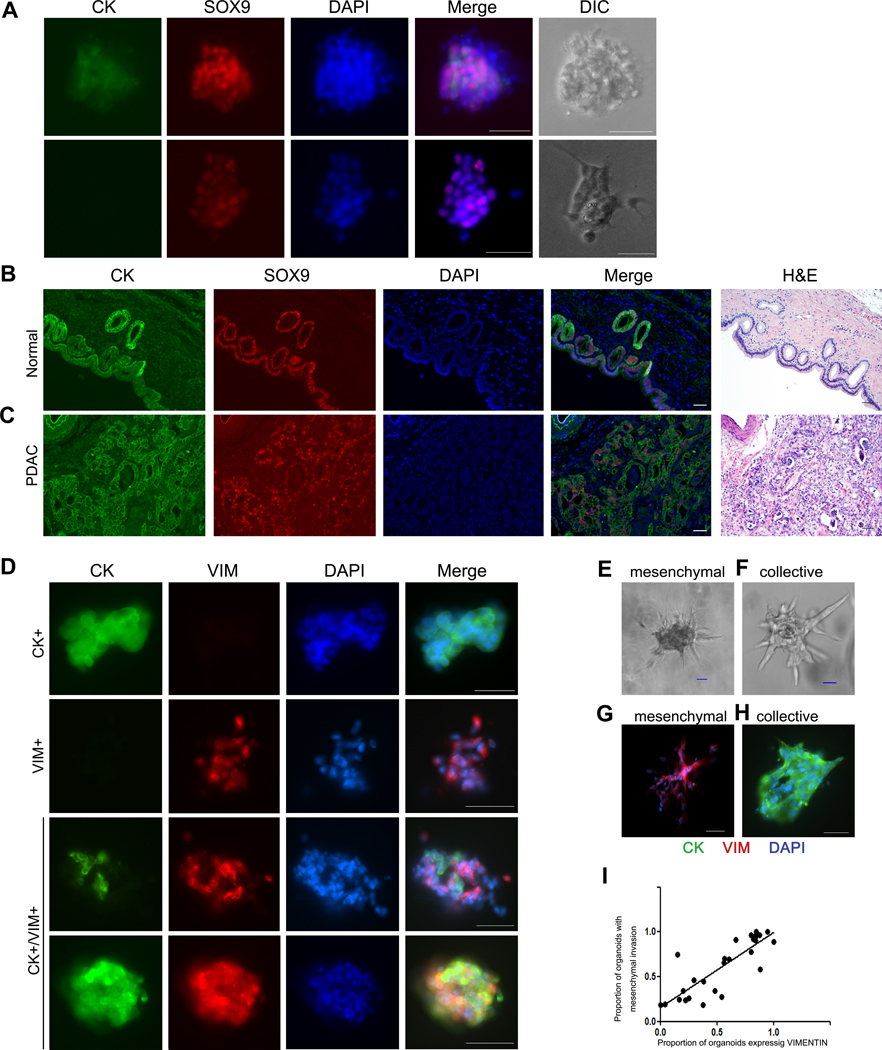
Figure 1. Expression of cytokeratin, vimentin, and SOX9 in human PDAC organoids and pancreatic tissue.

(A) Immunofluorescence co-staining of PDAC organoids for cytokeratin (green) and SOX9 (red) reveals that even cytokeratin-negative organoids express SOX9. Scale bars, 25 um. Images show two representative organoids (rows). (B-C) Immunofluorescence co-staining of normal pancreas and PDAC tissue with cytokeratin (green) and SOX9 (red). Scale bars, 50 um. (B) Representative normal pancreas sample shows SOX9 staining limited to ductal epithelium. (C) Representative PDAC sample shows SOX9 localization in malignant cells, but the stroma remains negative. (D) Immunofluorescence co-staining of PDAC organoids for cytokeratin (green) and vimentin (red) demonstrates variable expression patterns, including organoids expressing each marker alone, as well as organoids expressing both cytokeratin and vimentin. Scale bars, 25 um. (E-F) PDAC organoids invade with different phenotypes in collagen I gels: (E) mesenchymal invasion (F) collective invasion. (G-H) Immunofluorescence co-staining of PDAC organoids for cytokeratin (green) and vimentin (red) after 48 hours in culture in collagen I gels shows that organoids with mesenchymal invasion express vimentin, while those with collective invasion express cytokeratin. (I) Correlation of vimentin expression and mesenchymal invasion in PDAC organoids cultured in collagen I gel.
