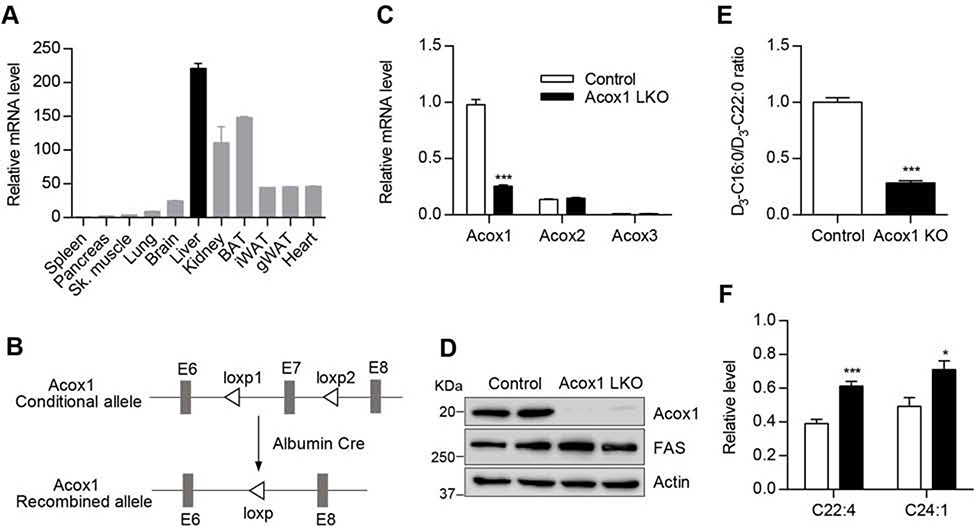
Figure 1. Generation of mice with liver-specific knockout of Acox1.
A) Acox1 mRNA expression level was measured by quantitative real time PCR in various tissues from wild type C57 mice (n=2). B) Acox1 floxed mice were crossed with albumin-Cre mice to generate Acox1 liver specific knockout mouse. C) Quantitative real time PCR analysis of Acox1, Acox2 and Acox3 expression in the liver of control and Acox1-LKO mice; n = 5–7 per group, ***p < 0.001 (unpaired t-test). D) Western blot analysis of Acox1 knockout in the liver. E) Control and Acox1-KO hepatocytes were incubated with D3-C22:0, whose catabolism to D3-C16:0 was measured by mass spectrometry. FAO was expressed as ratio of D3-C16:0 to D3-C22:0; n = 4, ***p < 0.001 (unpaired t-test). F) Levels of VLCFA in the livers of Acox1-LKO and control mice; n = 6–8 per group), *p < 0.05; ***p < 0.00l (unpaired t-test). Data represent mean ± SEM. See also Figure S1.

