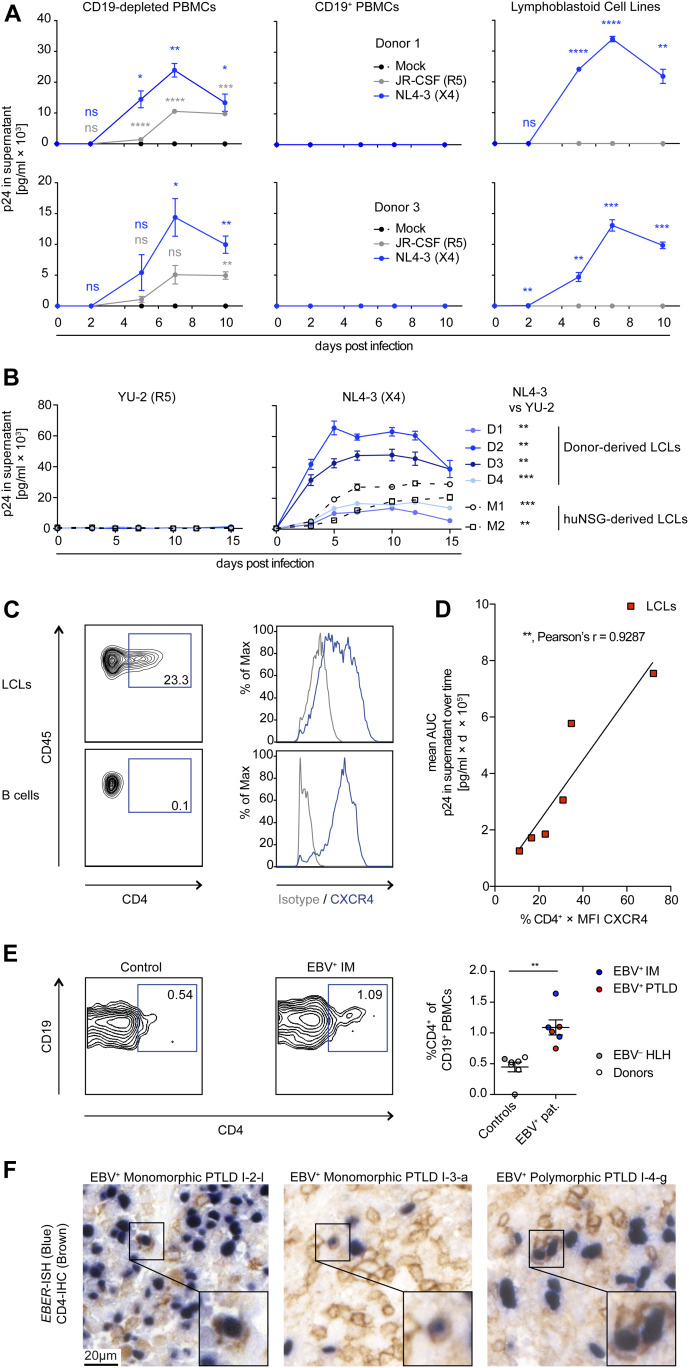
Figure 1. X4-tropic HIV-1 replicates in EBV-transformed B cells in vitro.
(A) Quantification of p24 via ELISA in supernatants collected over 10 d from in vitro HIV-1–infected CD19+ B-cell–depleted PBMCs, purified CD19+ B cells and lymphoblastoid cell lines (LCLs) from two donors. Cells were either mock-infected, infected with JR-CSF (R5-tropic HIV-1), or NL4-3 (X4-tropic HIV-1). Data from two donors are depicted. Adjusted P-value summaries for comparison of NL4-3 and JR-CSF versus Mock are indicated in blue and grey, respectively, from two-tailed unpaired t tests, corrected by the Holm–Sidak method. (B) Quantification of p24 in supernatants collected over 15 d from HIV-1–infected LCLs derived from four donors and two EBV-infected humanized mice reconstituted with fetal liver-derived CD34+ cells. Cells were infected with YU-2 (R5-tropic HIV-1) or NL4-3. The area under the curve (AUC, p24 in the supernatant versus time postinfection) was compared via two-tailed unpaired t test with Welch’s correction. (C) Representative flow cytometry plots and histograms of LCLs and autologous purified B cells stained for CD45, CD4, and CXCR4. (D) Correlation of NL4-3 HIV-1 replication in different LCLs with the level of CXCR4 and CD4 surface expression before infection. HIV-1 replication was approximated via analyzing the AUC for each LCL as shown in (B). Relative surface expression of HIV entry receptors for each LCL was approximated by multiplying the frequency of CD4+ cells with the median fluorescence intensity of CXCR4 as determined by flow cytometry immune phenotyping. Correlation, **P = 0.0074, Pearson’s r = 0.9287. (E) Representative flow cytometry immune phenotyping logarithmic contour plots and quantification of CD4 surface expression on CD19+ B cells from controls (healthy blood donors and 1 EBV− hemophagocytic lymphohistiocytosis [HLH] patient) and EBV+ infectious mononucleosis or EBV+ posttransplant lymphoproliferative disorder (PTLDs) patients. Events were pre-gated on single cells/lymphocytes/CD3−/CD19+ cells. **P = 0.001 (Mann–Whitney test). (F) Dual EBER in situ hybridization (blue) CD4 immunohistochemistry (IHC, brown) on tissue microarrays of two cases of EBV+ PTLD. I-2-l and I-3-a are separate sections from the same PTLD. Scale bar: 20 μm. Inserts are a 2× magnification of a section of the main image. In (A, B, C), data are represented as mean ± SEM and were performed in triplicate. Results representative of four donors. P-values are reported as ns > 0.05, * < 0.05, ** < 0.01, *** < 0.001, **** < 0.0001.

