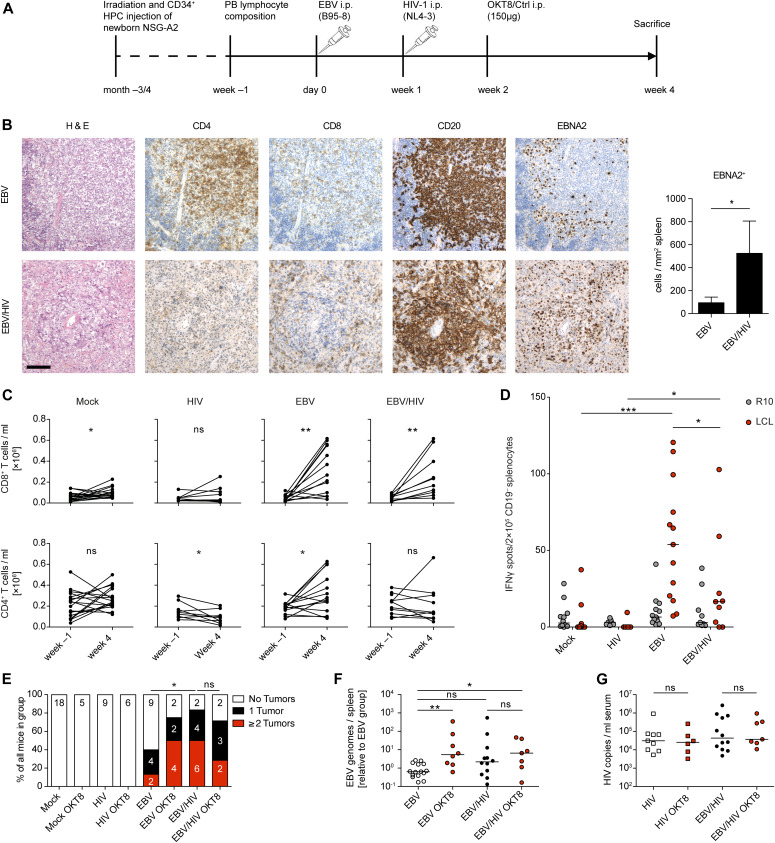
Figure 3. EBV/HIV dual-infection of humanized mice.
(A) Experimental setup: newborn NSG-A2 mice were irradiated and received intrahepatic injection of human CD34+ hematopoietic progenitor cells. Before infection, baseline blood lymphocyte composition was determined by flow cytometry and mice were grouped. At day 0, mice were infected i.p. with EBV or PBS and 1 wk later with HIV-1 or PBS. At week 2 post-infection, mice received a single injection of a CD8-depleting monoclonal antibody (OKT8) or an isotype control antibody. In one experiment, mice were left untreated. Mice were euthanized 4 wk post-EBV infection. (B) Representative histological panel of formalin-fixed, paraffin-embedded spleen sections from EBV and EBV/HIV–infected huNSG-A2 mice depicting H&E, CD4, CD8, CD20 and EBNA2 IHC stainings. Scale bar: 100 μm. Quantification of EBNA2+ cells per square millimeter with n = 7 and 5 mice, respectively. *P = 0.030 (Mann–Whitney test, MWT). (C) Number of CD8+ and CD4+ T cells per ml blood at week −1 and at week 4. Mock; CD8+ *P = 0.049. HIV; CD4+ *P = 0.042. EBV; CD8+ **P = 0.001 and CD4+ *P = 0.021. EBV/HIV; CD8+ **P = 0.007 (two-tailed paired t test). (D) EBV-specific T cell ELISpot assay. Mean IFNγ release was quantified upon co-culture of CD19-depleted splenocytes derived from humanized mice of the indicated groups with autologous EBV-transformed B cells (lymphoblastoid cell lines or LCLs) or medium (R10). Mock versus EBV ***P < 0.001; HIV versus EBV/HIV *P = 0.013; EBV versus EBV/HIV *P = 0.045 (MWT). (E) Presence of macroscopically visible EBV-associated tumors in animals from the indicated experimental groups. *P = 0.016 (MWT for tumor score). (F) Total splenic EBV DNA burden was determined for each mouse by qPCR for EBV BamHI W fragment and plotted relative to EBV-infected animals. EBV versus EBV OKT8 treated *P = 0.005; EBV versus EBV/HIV P = 0.060; EBV versus EBV/HIV OKT8 treated **P = 0.035; EBV/HIV versus EBV/HIV OKT8 treated P = 0.583 (MWT). (G) Serum HIV RNA copy numbers were determined by RT-qPCR at week 4 (MWT). (B, C, D, E, F, G) Represents pooled data from three experiments. (F, G) Individual values for each mouse and median are depicted.

