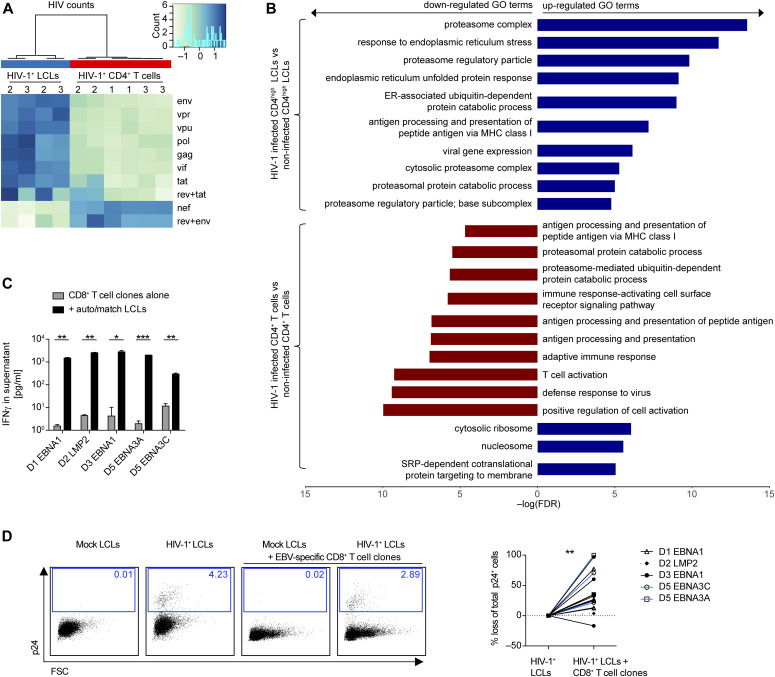
Figure 5. Susceptibility of HIV-1–infected lymphoblastoid cell lines (LCLs) to T-cell clones in vitro.
(A) Heat map depicting the HIV transcriptome in HIV-1–infected LCLs (2 donors) and three PB CD4+ T cells. Two of the CD4+ T cells investigated were autologous to the LCLs. Two separate infections were performed for each cell type. (B) Bar chart depicting selected results from gene set enrichment analysis of HIV-1–infected T cells and LCLs relative to mock-infected controls. (A, B) RNA was extracted 2 d after HIV-1 infection. (C) Reactivity of 5 EBV-specific CD8+ T-cell clones from four donors with or without autologous or HLA-matched LCLs (auto/match) measured by IFNγ ELISA of the culture supernatant. Donor and specificity for EBV protein: D1 EBNA1, D2 LMP2, D3 EBNA1, D5 EBNA3A, and D5 EBNA3C. Mean ± SD (two-tailed unpaired t tests, corrected by the Holm–Sidak method). (D) Representative flow cytometry plots from intracellular staining for p24 of mock-infected LCLs, HIV-1–infected LCLs, mock-infected LCLs mixed with an autologous EBV-specific CD8+ T-cell clone and HIV-1–infected LCLs mixed with an autologous EBV-specific CD8+ T-cell clone indicating percentage of p24-positive of total LCL population. Plots were pre-gated on live, single, total LCLs-labelled before co-culture with a lipophilic membrane dye (PKH67). Specific elimination of p24+ autologous or HLA-matched LCLs by individual EBV-specific CD8+ T-cell clones expressed as percentage loss of % p24+ cells in cocultures with T-cell clones compared with conditions without. Pooled from eight individual experiments, each condition was performed with 2–4 technical replicates (Wilcoxon matched pairs test). (C, D) P-values are reported as ns P > 0.05, *P < 0.05, **P < 0.01, ***P < 0.001.

