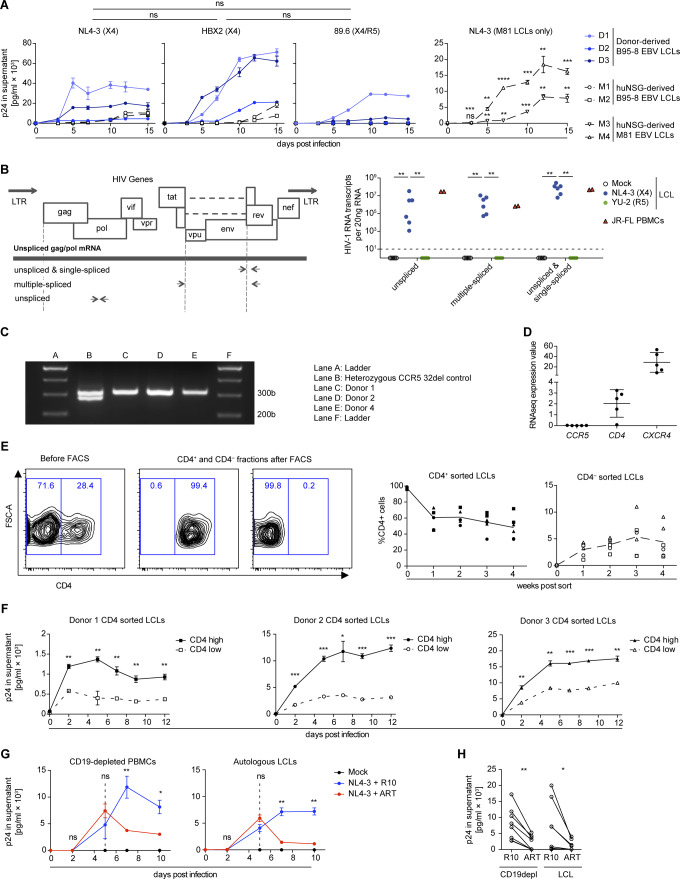
Figure S1. HIV-1 infects lymphoblastoid cell lines (LCLs) in a X4- and CD4-dependent manner.
(A) Quantification of p24 by ELISA in supernatants collected from in vitro NL4-3, HBX2, and 89.6 HIV-1–infected LCLs. The mean AUC (p24 in the supernatant versus time postinfection) from five LCLs was compared via the Mann–Whitney test. M81 EBV LCLs derived from EBV-infected humanized mice generated from two individual human fetal liver donors. Adjusted P-value summaries for comparison of NL4-3–infected M81 LCLs versus Mock are depicted from two-tailed unpaired t tests, corrected by the Holm–Sidak method. Data are represented as mean ± SEM and were performed in triplicates. (B) Wild-type HIV-1 gene map showing position of primers used to detect unspliced, single-spliced, and multiple-spliced HIV-1 mRNA transcripts (left). Quantification of HIV-1 RNA transcripts per 20 ng of RNA in six LCLs (four derived from donors and two from EBV-infected humanized mice) and one PBMC donor was performed 15 d postinfection (right). LCLs were infected with X4-tropic NL4-3 and R5-tropic YU-2 HIV-1 strains, and control PBMCs were infected with JR-FL R5-tropic HIV-1 strain (two-tailed Fischer’s exact test for presence versus absence of HIV-1–specific transcripts). (C) Representative PCR results for genotyping CCR5 alleles in LCLs donors used in this study. Amplification of the homozygous wild-type allele (CCR5+/+) results in a single band of 311 bp. Amplification of the heterozygous allele (CCR5+/delta32) results in two bands of 311 and 279 bp. (D) Mean expression values as determined by RNA-seq for CCR5, CD4, and CXCR4 transcripts in five different LCLs (two humanized mice-derived and three donor-derived LCLs) are plotted. Each plotted value is the mean expression value (=RPKM) from three biological replicates (RNA sequencing data from McHugh et al (53)). (E) Sorted CD4+ and CD4− LCLs populations and subsequent quantification of the frequency of CD4 surface expression over 4 wk of in vitro culture. Two independent experiments with three donors; means are indicated with connecting lines. (F) Quantification of p24 by ELISA in supernatants collected from in vitro NL4-3 HIV-1–infected CD4 high and CD4 low LCLs from three donors. The infection was performed in triplicate 4 wk after sorting for CD4. Data are represented as mean ± SEM. Adjusted P-value summaries for comparison of CD4 high versus low LCLs are depicted from two-tailed unpaired t tests, corrected by the Holm–Sidak method. (G) Anti-retroviral treatment (ART) of in vitro NL4-3 HIV-1–infected LCLs and autologous CD19+ B-cell–depleted PBMCs. 5 d postinfection, the cells were treated with AZT and Efaverenz or medium (R10). Data are represented as mean ± SEM and were performed in triplicate. Results are representative of four donors. Adjusted P-value summaries for comparison of ART-treated versus R10 treated are depicted from two-tailed unpaired t tests, corrected by the Holm–Sidak method. (H) Summary of mean p24 concentrations in culture supernatants of HIV-1–infected LCLs and autologous CD19-depleted PBMCs cultured in R10 with or without ART treatment. CD19depl **P = 0.001; LCL *P = 0.049 (two-tailed paired t test). (A, B, F, H) *P < 0.05, **P < 0.01, ***P < 0.001, ****P < 0.0001.

