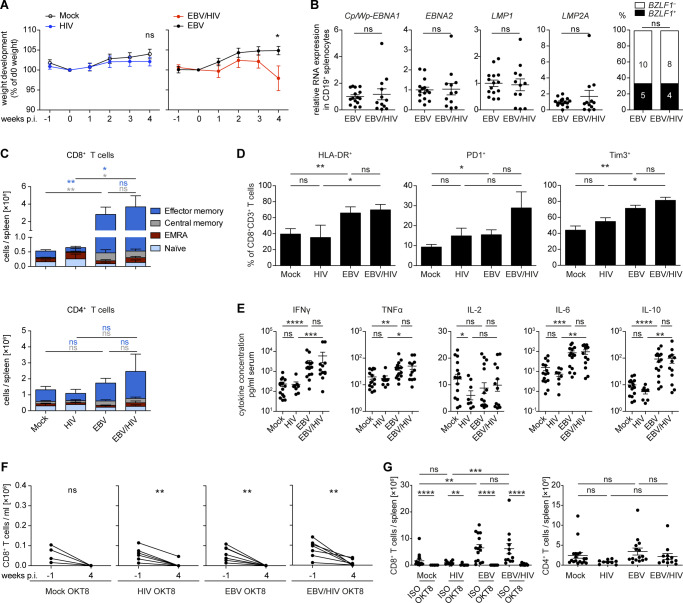
Figure S2. Characteristics of humanized mice during EBV/HIV dual-infection.
(A) Weight development comparing Mock versus HIV P = 0.326 and EBV versus EBV/HIV *P = 0.029—infected mice relative to day 0 and up to week 4 post EBV infection (two-tailed unpaired t test at week 4). (B) Quantification of EBV transcripts Cp/Wp-EBNA1 P = 0.608, EBNA2 P = 0.643, LMP1 P = 0.714, and LMP2A P = 0.696 via RT-qPCR in CD19+ splenocytes of EBV-infected and EBV/HIV–infected mice. Data normalized to the mean of the EBV group values (Mann–Whitney test [MWT]). Frequency of detection of the BZLF1 transcript in CD19+ B cells from individual mice (Fischer’s exact test). (C) Differentiation status of splenic CD8+ and CD4+ T cells at termination. Mean ± SEM total number of CD8+ and CD4+ T cells per spleen is shown. Effector Memory: CD62L− CD45RA−. Central Memory: CD62L+ CD45RA−. EMRA: CD62L− CD45RA+. Naive: CD62L+ CD45RA+ (MWT for Central and Effector Memory). (D) Frequency of HLA-DR, PD1, and Tim3 surface expression on splenic CD8+ T cells at 4 wk post EBV infection (MWT). (E) Quantification of cytokines in the serum of mice 4 wk post EBV infection (MWT). (F) Number of CD8+ T cells per ml blood for individual mice at week −1 and week 4 in mice that received OKT8 treatment at week 2. Mock OKT8: P = 0.064. HIV OKT8: **P = 0.003. EBV OKT8: **P = 0.002. EBV/HIV OKT8: **P = 0.006 (two-tailed paired t test). (G) Absolute numbers of CD8+ and CD4+ T cells per spleen in mice from different experimental groups were quantified at week 4 (MWT). (A, B, C, D, E, F, G) Data pooled from two to four experiments and in (A, B, C, D, E, G) represented as mean ± SEM, ns P > 0.05, *P < 0.05, **P < 0.01, ***P < 0.001, ****P < 0.0001.

