Figure 3.

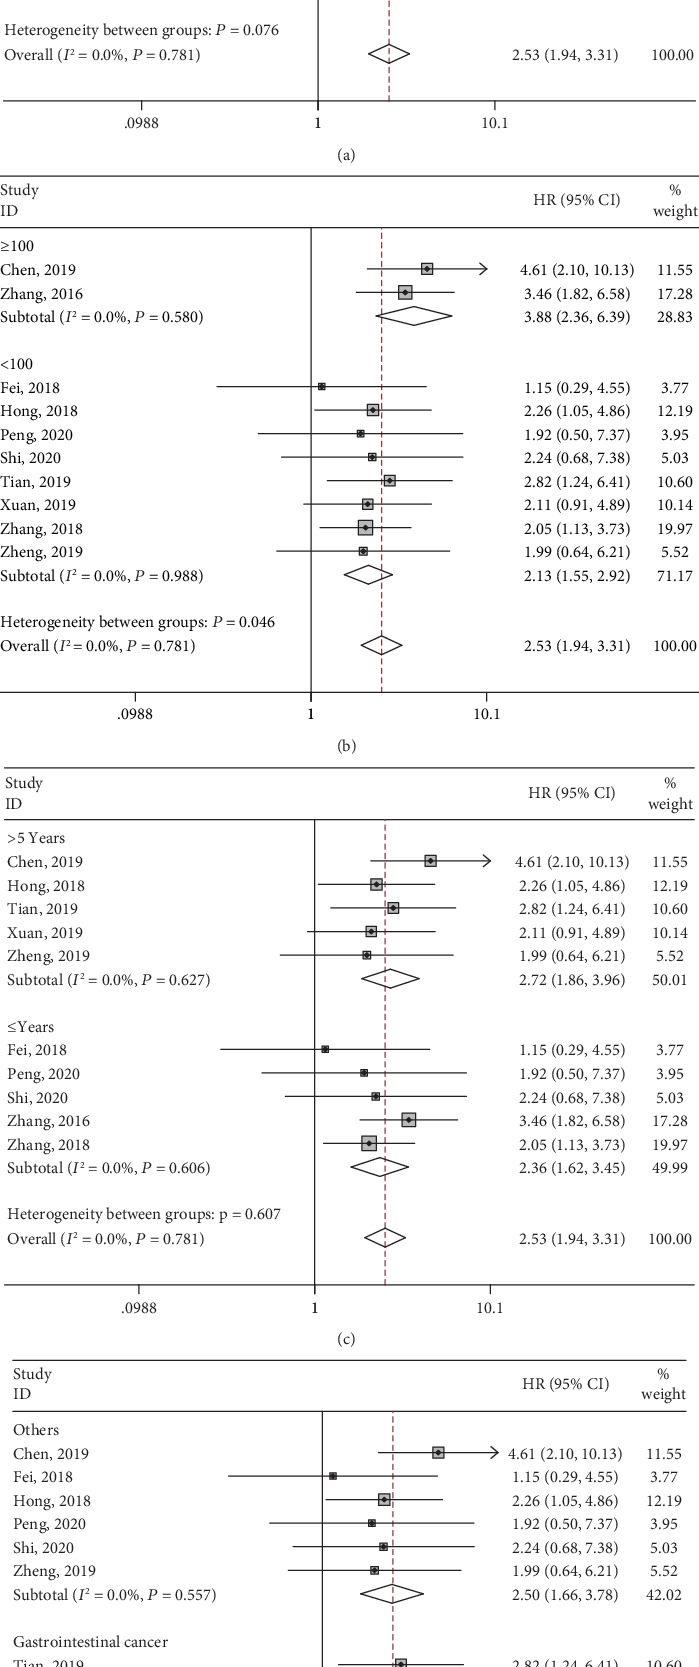
Forest plots of hazard ratios for overall survival: (a) stratified by analysis type, (b) stratified by sample size, (c) stratified by follow-up time, and (d) stratified by cancer type.

Forest plots of hazard ratios for overall survival: (a) stratified by analysis type, (b) stratified by sample size, (c) stratified by follow-up time, and (d) stratified by cancer type.