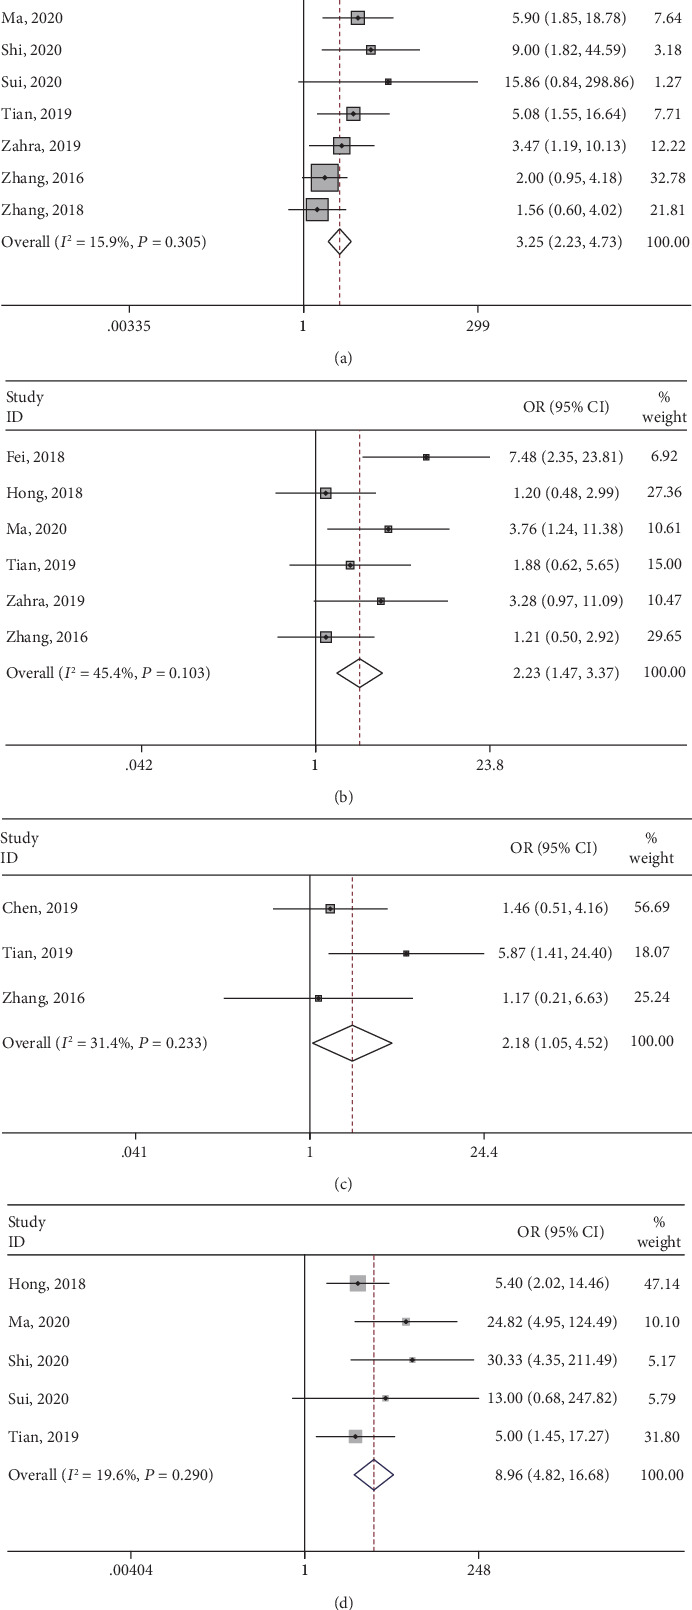
Figure 4.

Forest plots of odds ratios for correlation between high SNHG3 expression and clinical parameters: (a) clinical stage, (b) histological grade, (c) distant metastasis, and (d) lymph node metastasis.

Forest plots of odds ratios for correlation between high SNHG3 expression and clinical parameters: (a) clinical stage, (b) histological grade, (c) distant metastasis, and (d) lymph node metastasis.