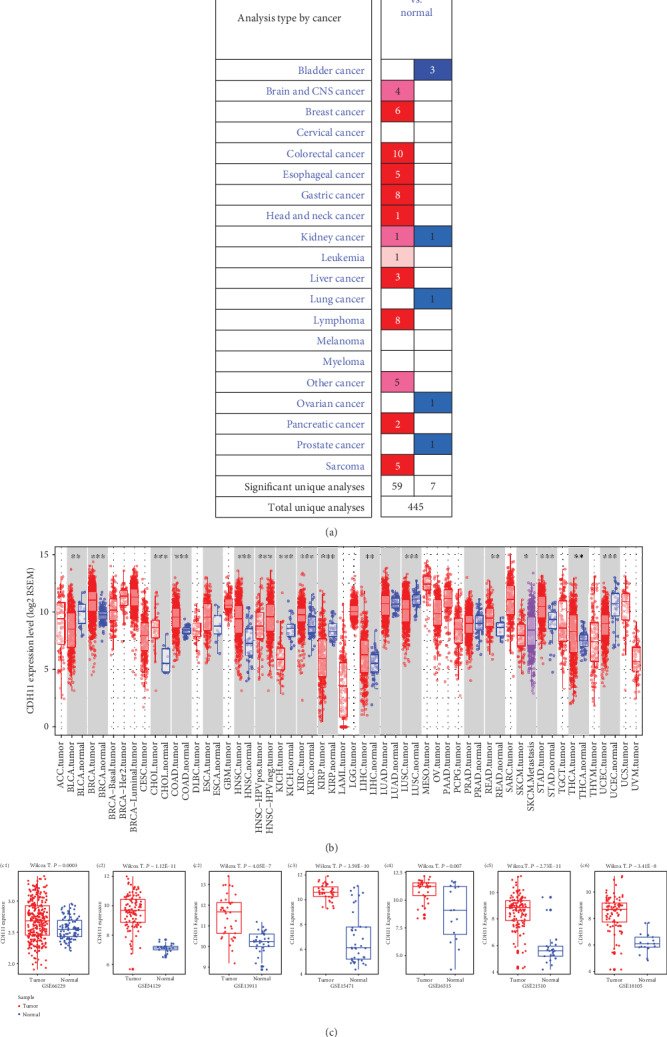
Figure 1.

Expression levels of CDH11 in various human cancers. (a) Increased or decreased CDH11 in different cancers compared with normal tissues in the Oncomine database. (b) Expression levels of CDH11 in different tumor types from the TIMER database (∗P < 0.05, ∗∗P < 0.01, and ∗∗∗P < 0.001). (c) (c1–c3) Expression levels of CDH11 in gastric cancer datasets from the GEO database (Wilcox T.: Wilcox. test; E: exponent). (c4, c5) Expression levels of CDH11 in pancreatic cancer datasets from the GEO database. (c6, c7) Expression levels of CDH11 in colorectal cancer datasets from the GEO database. Red represents high expression levels, and blue represents low expression levels.
