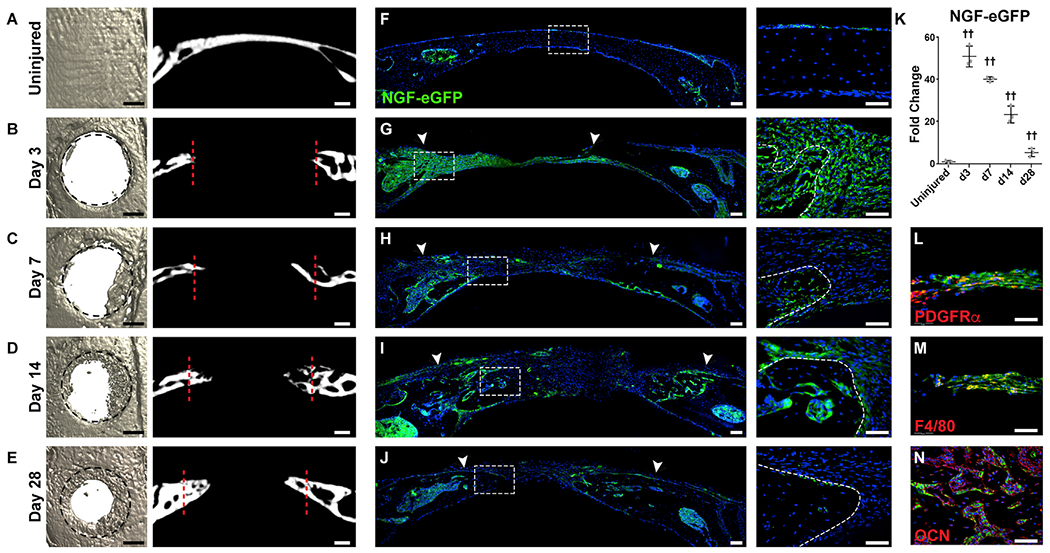
Figure 2. NGF-eGFP Reporter Activity following Calvarial Bone Injury.

NGF-eGFP reporter animals were subjected to a circular, full-thickness frontal bone defect (1.8 mm in diameter).
(A–E) μCT reconstructions of the defect site in a top-down view (left) and coronal cross-sectional images (right) among (A) uninjured frontal bones and (B–E) d3–d28 post-injury. Margins of original defect are indicated by dashed black or red lines. Black scale bar, 500 μm; white scale bar, 200 μm.
(F–J) Representative tile scans (left) and high-magnification images (right) of NGF-eGFP reporter activity in the calvarial defect site at serial time points, including (F) uninjured frontal bones and (G–J) d3–d28 post-injury. Reporter activity appears green, while nuclear counterstain appears blue. Uninjured control is shown for comparison. White arrowheads indicate margins of defect site. Dashed white lines indicate healing bone edge. White scale bar, 50 μm.
(K) Quantification of relative NGF-eGFP reporter activity from d3–d28 post-injury.
(L–N) Immunohistochemical staining (appearing red) within the defect area of NGF-eGFP reporter animals, including (L) PDGFRα (platelet-derived growth factor receptor α), d3 post-injury; (M) F4/80, d3 post-injury; and (N) osteocalcin (OCN), d14 after injury. In graphs, each dot represents a single animal; n = 3 animals per time point. White scale bar, 50 μm. Data are represented as mean ± SD.
