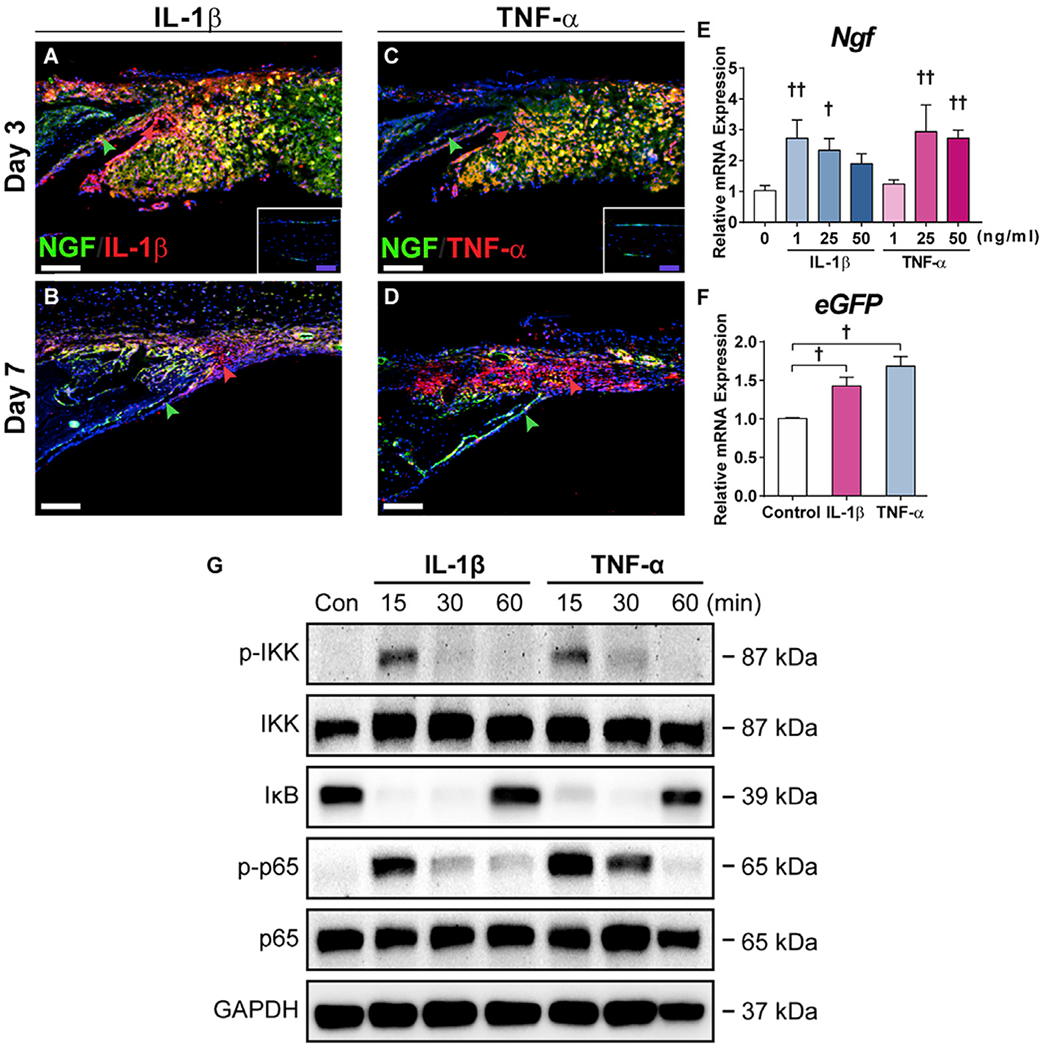
Figure 3. Inflammatory Cytokines Induce Ngf Expression within Calvarial Osteoblasts.

(A and B) Immunohistochemistry for IL-1β, appearing red, on the calvarial injury site within NGF-eGFP reporter sections at (A) d3 and (B) d7 post-injury. Green arrowheads indicate bone-lining eGFP reporter activity, while red arrowheads indicate immunoreactivity within the defect site. White dashed lines indicate bone edges. Inset demonstrates immunoreactivity among uninjured calvarial bone. White scale bar, 50 μm; purple scale bar, 20 μm.
(C and D) Immunohistochemistry for TNF-α, appearing red, on the calvarial injury site within NGF-eGFP reporter sections at (C) d3 and (D) d7 post-injury. Green arrowheads indicate bone-lining eGFP reporter activity, while red arrowheads indicate immunoreactivity within the defect site. White dashed lines indicate bone edges. Inset demonstrates immunoreactivity among uninjured calvarial bone. White scale bar, 50 μm; purple scale bar, 20 μm.
(E) Ngf expression among calvarial osteoblasts 48 h after treatment with recombinant IL-1β or TNF-α, assessed using qRT-PCR.
(F) eGFP expression among NGF-eGFP-derived calvarial osteoblasts 48 h after treatment with IL-1β (1 ng/mL) or TNF-α (25 ng/mL), assessed using qRT-PCR.
(G) NF-κB signaling among calvarial osteoblasts 15–60 min after treatment with IL-1β (1 ng/mL) or TNF-α (25 ng/mL), assessed using western blot.
All experiments were performed in triplicate. Representative histologic images are from n = 3 mice per time point. †p < 0.05 and ††p < 0.01 in comparison with control. Data are represented as mean ± SD.
