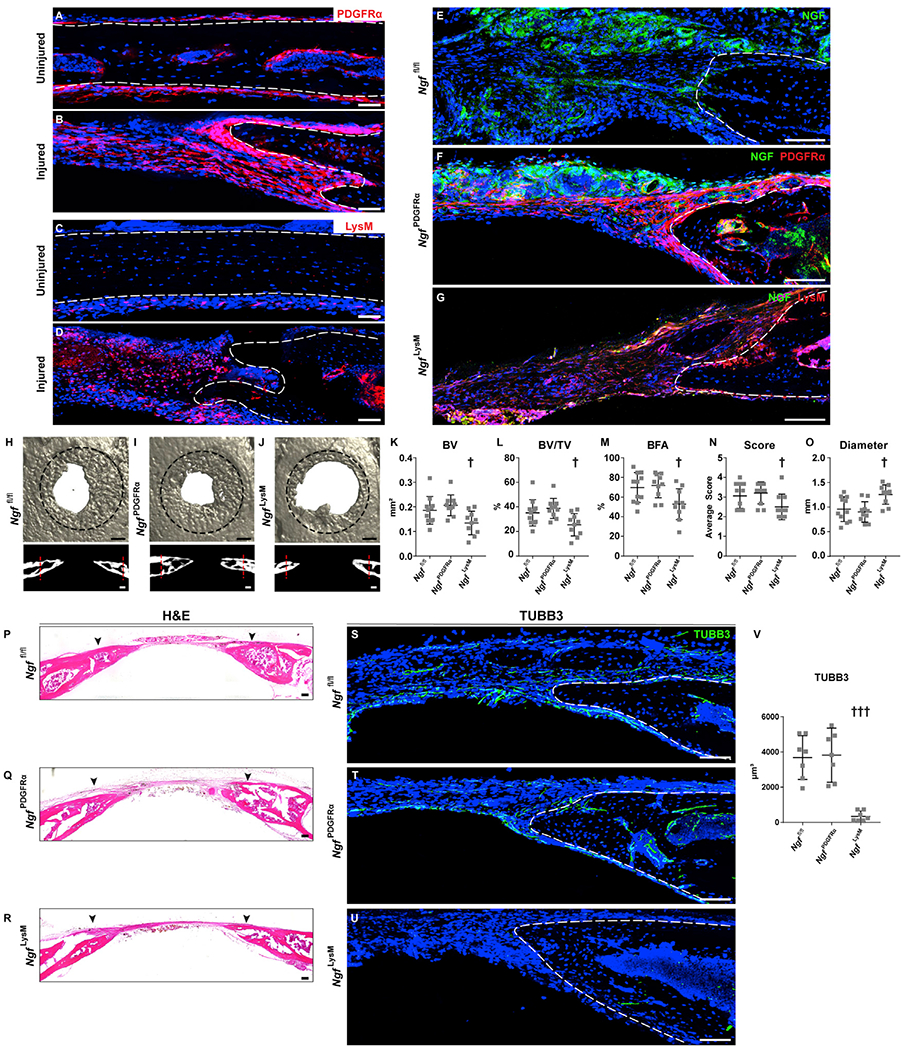
Figure 6. Tissue-Specific Deletion of Ngf in LysM-Expressing Cells but Not Pdgfrα-Expressing Cells Blunts Calvarial Bone Defect Repair.

Tissue-specific deletion of Ngf was performed using LysM-Cre (NgfLysM) or Pdgfrα-CreERT2 lines (NgfPdgfrα), and bone healing was compared with Cre− animals (Ngffl/fl). Healing was assessed using a 1.8 mm, circular, full-thickness frontal bone defect.
(A–D) Location of PDGFRα or LysM reporter activity before and after injury. (A and B) PDGFRα reporter activity (PDGFRα-CreERT2-mGFP, recolored red) within the uninjured frontal bone and at d3 post-injury. White scale bar, 50 μm. (C and D) LysM reporter activity (LysM-Cre-tdTomato) within the uninjured frontal bone and at d3 post-injury. White dashed lines indicate bone edges. White scale bar, 50 μm.
(E–G) Validation of Ngf deletion in either PDGFRα-expressing stromal cells (NgfPdgfrα) or LysM-expressing monocytes/macrophages (NgfLysM) in comparison with Ngffl/fl mice, d3 post-injury. NGF immunohistochemistry among (E) Ngffl/fl control bone defects, (F) NgfPdgfrα bone defects, or (G) NgfLysM bone defects. NGF immunostaining appears green, while reporter activity appears red. White scale bar, 50 μm.
(H–J) μCT reconstructions of the defect site in a top-down view (above) and coronal cross-sectional images (below) among (H) Ngffl/fl, (I) NgfPdgfrα, and (J) NgfLysM animals. Margins of original defect are indicated by dashed black or red lines. Black scale bar, 500 μm; white scale bar, 200 μm.
(K–O) μCT quantification of bone healing among Ngffl/fl, NgfPdgfrα, and NgfLysM mice including (K) bone volume (BV), (L) bone volume/tissue volume (BV/TV), (M) bone formation area (BFA), (N) bone healing score (score), and (O) defect diameter.
(P–R) H&E stain of coronal cross-section of the healing defect site from (P) Ngffl/fl, (Q) NgfPdgfrα, and (R) NgfLysM mice. Black arrowheads indicate span of initial defect. Black scale bar, 50 μm.
(S–V) Immunohistochemical staining of TUBB3+ (beta III tubulin) nerve fibers at the defect edge from (S) Ngffl/fl, (T) NgfPdgfrα, and (U) NgfLysM mice, appearing green, and (V) quantification of TUBB3 immunoreactivity within the calvarial defect. Dashed white lines indicate bone edge. White scale bar, 50 μm.
In graphs, each dot represents a single animal. n = 9–11 per group for (K)–(O) and N = 7 per group for (V). †p < 0.05 and †††p < 0.001 in comparison with Ngffl/fl and NgfPdgfrα. Data are represented as mean ± SD. See also Figure S5.
