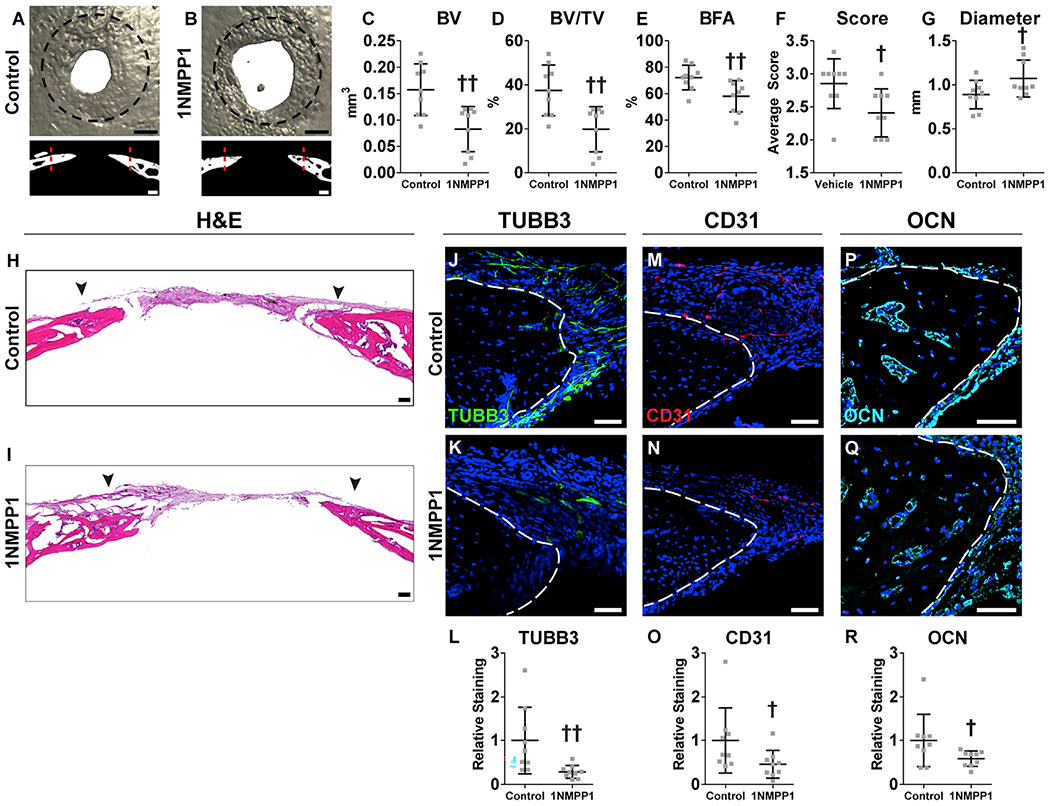
Figure 7. TrkA Inhibition Impairs Calvarial Bone Defect Repair.

TrkAF592A animals were treated systemically with 1NMPP1 (or vehicle control) to temporally inhibit TrkA catalytic activity, followed by creation of a 1.8 mm, circular, full-thickness frontal bone defect.
(A and B) μCT reconstructions of the defect site in a top-down view (above) and coronal cross-sectional images (below) among TrkAF592A animals treated with (A) vehicle control or (B) 1NMPP1. Black scale bar, 500 μm; white scale bar, 200 μm. Analysis performed at d28 post-injury. Margins of original defect are indicated by dashed black or red lines.
(C–G) μCT quantification of bone healing, among vehicle control or 1NMPP1-injected mice, including (C) bone volume (BV), (D) bone volume/tissue volume (BV/TV), (E) bone formation area (BFA), (F) bone healing score (score), and (G) defect diameter.
(H and I) H&E stain of representative coronal cross-section of the healing defect site from (H) vehicle control and (I) 1NMPP1-injected mice. Black arrowheads indicate span of initial defect. Black scale bar, 50 μm.
(J–L) Immunohistochemical staining of TUBB3+ (beta III tubulin) nerve fibers at the defect edge from (J) vehicle control and (K) 1NMPP1-injected mice, appearing green, and (L) quantification of TUBB3 immunoreactivity within the calvarial defect. Dashed white lines indicate bone edge.
(M–O) Immunohistochemical staining of CD31+ blood vessels at the defect edge from (M) vehicle control and (N) 1NMPP1-injected mice, appearing red, and (O) quantification of CD31 immunoreactivity within the calvarial defect site. Dashed white lines indicate bone edge.
(P–R) Immunohistochemical staining of OCN+ (osteocalcin) osteoblasts from (P) vehicle control and (Q) 1NMPP1-injected mice, appearing cyan, and (R) quantification of OCN immunoreactivity within the calvarial defect site. Dashed white lines indicate bone edge. White scale bar, 50 μm.
DAPI counterstain appears blue in all images. In graphs, each dot represents a single animal; n = 9 per group. †p < 0.05 and ††p < 0.01 in comparison with vehicle control. Data are represented as mean ± SD.
