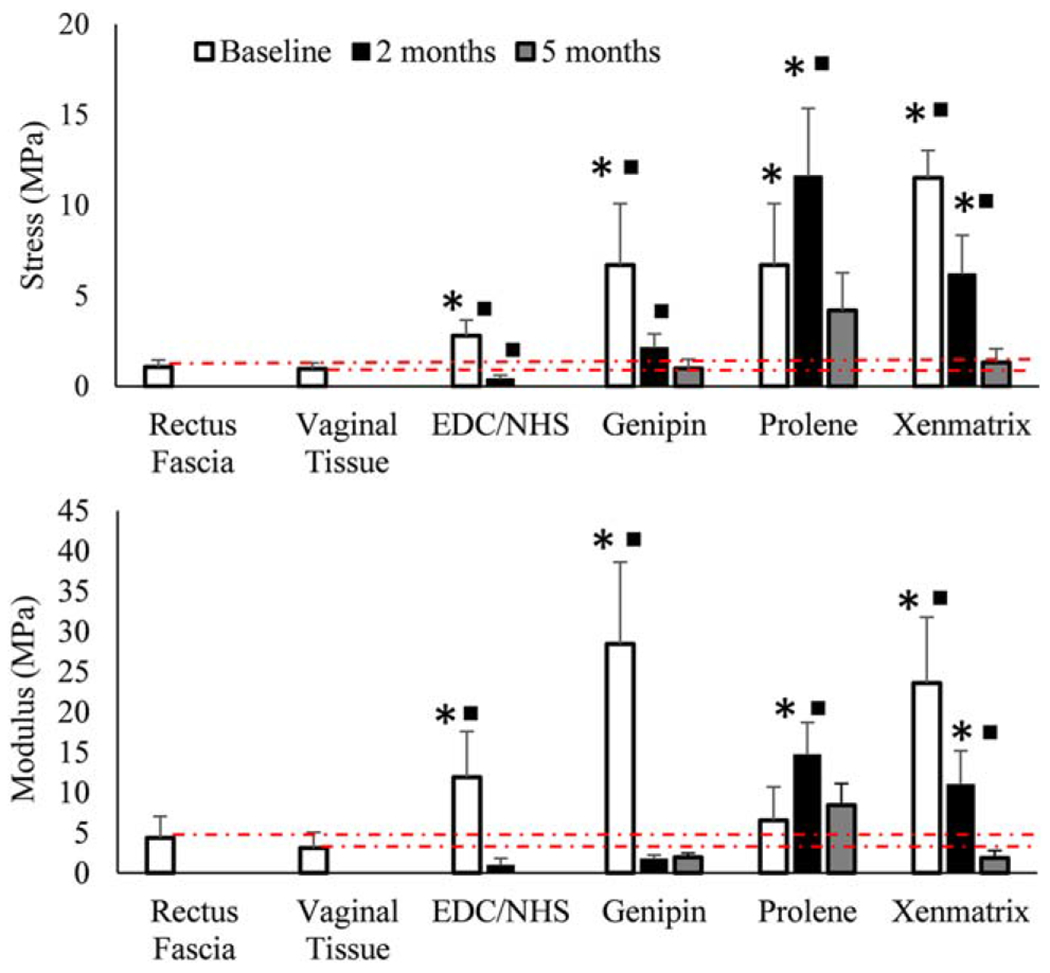
FIGURE 4.

Average (A) modulus and (B) stress to failure for meshes over time (n = 5 per time point). Squares indicate a value is significantly different (p<0.05) from the proceeding value (intra-group comparison) and stars indicate that a given value is significantly different (p<0.05) from native tissue at that time point (inter-group comparison). Dashed red lines are meant to show how meshes compare to native tissues over time. Error bars indicate the SD for test groups.
