
Fig. 5.
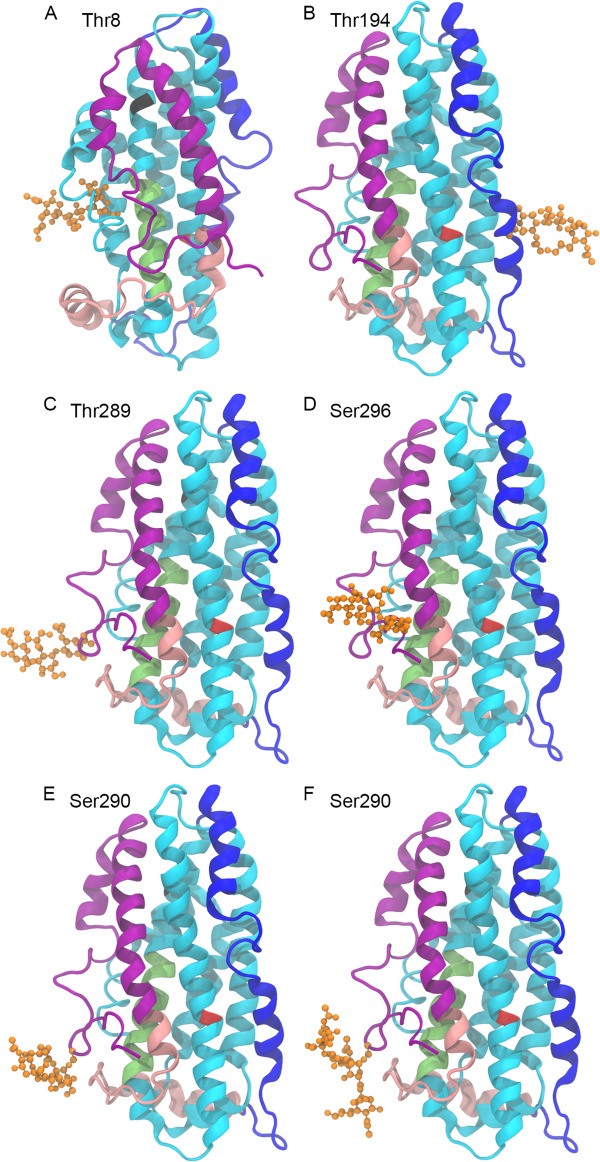
Structures of CSF and plasma glycovariants. All APOE structures are APOE3 NMR crystal structure 2L7B with the following glycosylation modeled at the indicated glycosites. (A) Thr8 glycosylated with Neu5Acα2–3Galβ1–3GalNAcα1-, most abundant in plasma APOE. (B) Thr194 glycosylated with Neu5Acα2–3Galβ1–3GalNAcα1-, identified in plasma and CSF APOE. (C–F) C-terminal glycosites, most abundant in CSF APOE. (C) Thr289 glycosylated with Neu5Acα2–3Galβ1–3GalNAcα1. (D) Ser296 glycosylated with Neu5Acα2–3Galβ1–3GalNAcα1. (E) Ser290 glycosylated with Neu5Acα2–3Galβ1–3GalNAcα1-. (F) Ser290 glycosylated with Neu5Acα2–3Galβ1–3(Neu5Acα2–6)GalNAcα1-. The protein backbone is displayed in NewCartoon. The N-terminal region is cyan with the LDL receptor-binding domain in lime. The hinge region is in blue. The C-terminal is in pink with the lipid-binding region in purple. Amino acid 112 is red, amino acid 158 is black. The glycan is in orange displayed in CPK.