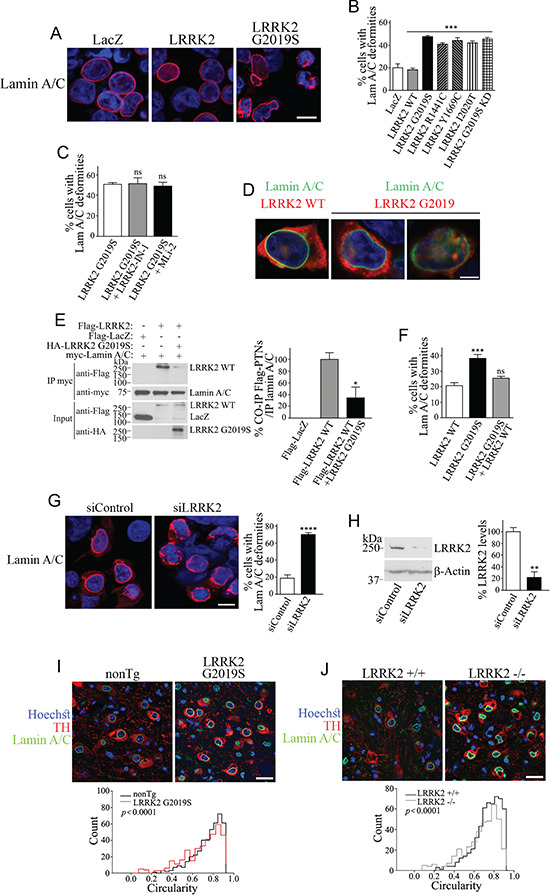
Figure 5.

LRRK2 mutations or LRRK2 knockdown/deletion destabilize lamin A/C network in vitro and transgenic mice models. (A) HEK293 cells were transfected with Flag-LRRK2, Flag-LRRK2 G2019S or Flag-LacZ. Cells were processed for immunocytochemistry with anti-lamin A/C and Hoechst 33342 and analyzed by confocal microscopy. Scale bar, 10 μm. (B) HEK293 cells were transfected with Flag-LRRK2, Flag-LRRK2 disease mutants (G2019S, R1441C, Y1669C, I2020T), LRRK2 G2019S kinase-dead (KD) or Flag-LacZ. Cells were processed and analyzed as in (A). The graph represents the percentage of cells displaying lamin A/C deformities. Values represent the mean ± S.E.M. of six independent experiments. Repeated-measures one-way ANOVA with Bonferroni post hoc test comparing mutants to LRRK2 wild-type control (P < 0.001). (C) HEK293 cells were transfected with Flag-LRRK2 G2019S mutant and treated without or with LRRK2 inhibitors (1 μm LRRK2-IN-1 or 30 nM MLi-2) for 16 h. The graph represents the percentage of cells exhibiting lamin A/C deformities. Values represent the mean ± S.E.M. of three to six independent experiments. Repeated-measures one-way ANOVA with Bonferroni post hoc test comparing mutants to LRRK2 G2019S without LRRK2 inhibitors (P > 0.999). Unpaired two-tailed Student’s t test (non-significant P = 0.821). (D) HEK293 cells were transfected with Flag-LRRK2 or Flag-LRRK2 G2019S. Cells were processed for immunocytochemistry with anti-LRRK2, anti-lamin A/C and Hoechst 33342 and analyzed by confocal microscopy. Scale bar, 5 μm. (E) Co-expression of HA-LRRK2 G2019S inhibits the co-immunoprecipitation of Flag-LRRK2 wild type with myc-Lamin A/C. Co-immunoprecipitation of LRRK2 wild type with lamin A/C was detected with anti-Flag (first panel) while levels of lamin A/C immunoprecipitation were determined with anti-myc (second panel). The third panel shows similar expression of Flag-LRRK2 wild type in the absence and presence of HA-LRRK2 G2019S. The fourth panel shows the levels of LRRK2 G2019S with anti-HA. The graph depicts the relative co-immunoprecipitation of LRRK2 wild type with lamin A/C, in the absence and presence of LRRK2 G2019S. Values represent the mean ± S.E.M. of three independent experiments. Unpaired two-tailed Student’s t test of LRRK2 WT co-immunoprecipitation in the presence of G2019S in contrast to that in the absence of G2019S (P = 0.038). (F) Percent of cells displaying lamin A/C deformities in HEK293 cells transfected with Flag-LRRK2 G2019S in the absence or presence of excess LRRK2 wild type. Values represent the mean ± S.E.M. of three independent experiments. Repeated-measures one-way ANOVA with Bonferroni post hoc test (P < 0.001 and = 0.344 for G2019S and G2019S plus WT, respectively, in contrast with WT alone). (G) HEK293 cells transfected with siRNA control or LRRK2 siRNA, processed and analyzed as in (A). Scale bar, 10 μm. The graph represents the percentage of cells with lamin A/C deformities. Values represent the mean ± S.E.M. of three independent experiments. Unpaired two-tailed Student’s t test (P < 0.0001). (H) Control showing the extent of siRNA-mediated LRRK2 silencing on levels of endogenous LRRK2 in HEK293 cells. The graph depicts the quantification of endogenous LRRK2 in the presence of different siRNAs. Values represent the mean ± S.E.M. of three independent experiments. Unpaired two-tailed Student’s t test (P = 0.003). (I) Substantia nigra from non-transgenic and G2019S overexpressing mice (12 months) was processed for immunohistochemistry with anti-lamin A/C, anti-tyrosine hydroxylase (TH) and Hoechst 33258 and analyzed by confocal microscopy. Scale bar, 25 μm. The histogram represents the distribution of lamin A/C circularity values in non-transgenic and LRRK2 G2019S Tg mice. Values represent the mean ± S.E.M. of three independent experiments with a total of 400 dopaminergic neurons analyzed per genotype. Mann–Whitney test (P < 0.0001). (J) Substantia nigra from non-transgenic and LRRK2 knockout mice (LRRK2 −/−) (12 months) were processed and analyzed as in (H). Scale bar, 25 μm. The histogram represents the distribution of lamin A/C circularity values in LRRK2 +/+ and LRRK2 −/− mice. Values represent the mean ± S.E.M. of three independent experiments with a total of 400 dopaminergic neurons analyzed per genotype. Mann–Whitney test (P < 0.0001).
