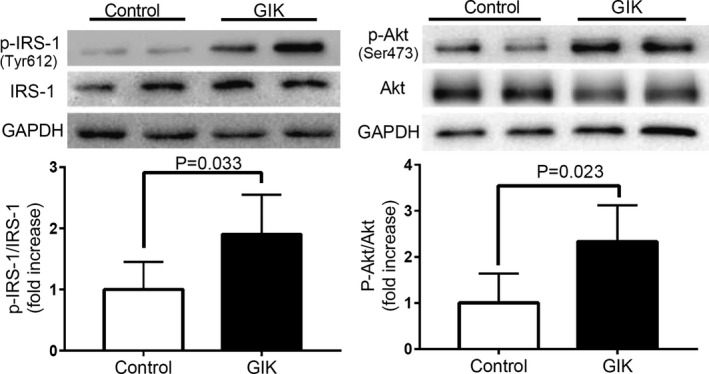
Figure 3.

Activation of insulin signaling in the hearts of GIK‐treated patients. Representative western blots and quantification of IRS‐1, Tyr phosphorylated IRS‐1, Akt, Ser473 phosphorylated Akt in cardiac biopsies. Each bar denotes mean±SD intensities quantified by densitometric analysis of the immunoblots. n=10 per group. Akt indicates protein kinase 1; GAPDH, glyceraldehyde 3‐phosphate dehydrogenase; GIK, glucose‐insulin‐potassium; IRS‐1, insulin receptor substrate 1; p‐Akt, phospho‐Akt; p‐IRS‐1, phospho‐IRS‐1.
