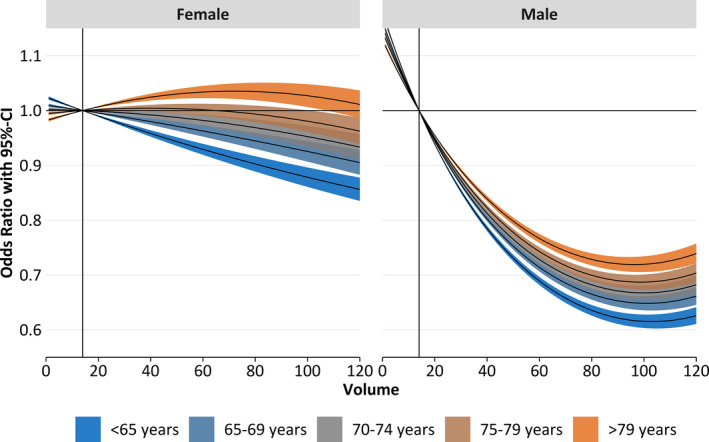
Figure 3.

Odds ratios and 95% CIs of the volume‐outcome relationship by sex (women [left] and men [right]) and age (indicated by color). The median annual volume (14 cases; indicated by vertical line) was set as reference. Odds ratios were compared with the median annual hospital volume (14 cases) and corresponding 95% CI evaluated at the median age within each age group.
