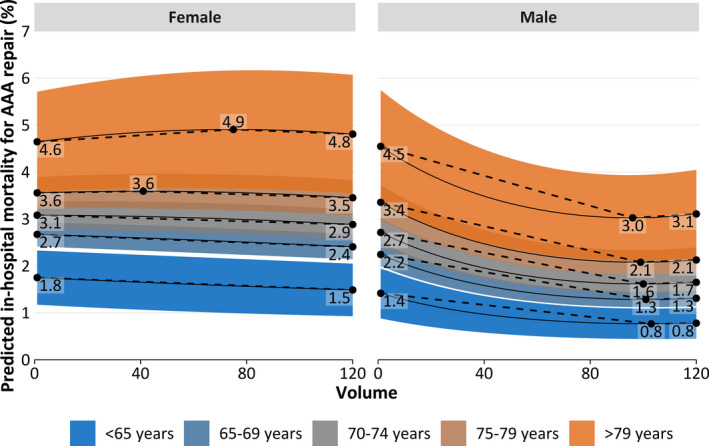
Figure 6.

Predicted in‐hospital mortality depending on annual hospital volume by sex (women [left] and men [right]) and age (indicated by color) for all cases (open aortic repair and endovascular aortic repair [EVAR]), amended by highlighted extrema (black dots). Averaged on Figure 5A and 5B by EVAR proportion within each stratum. AAA indicates abdominal aortic aneurysm.
