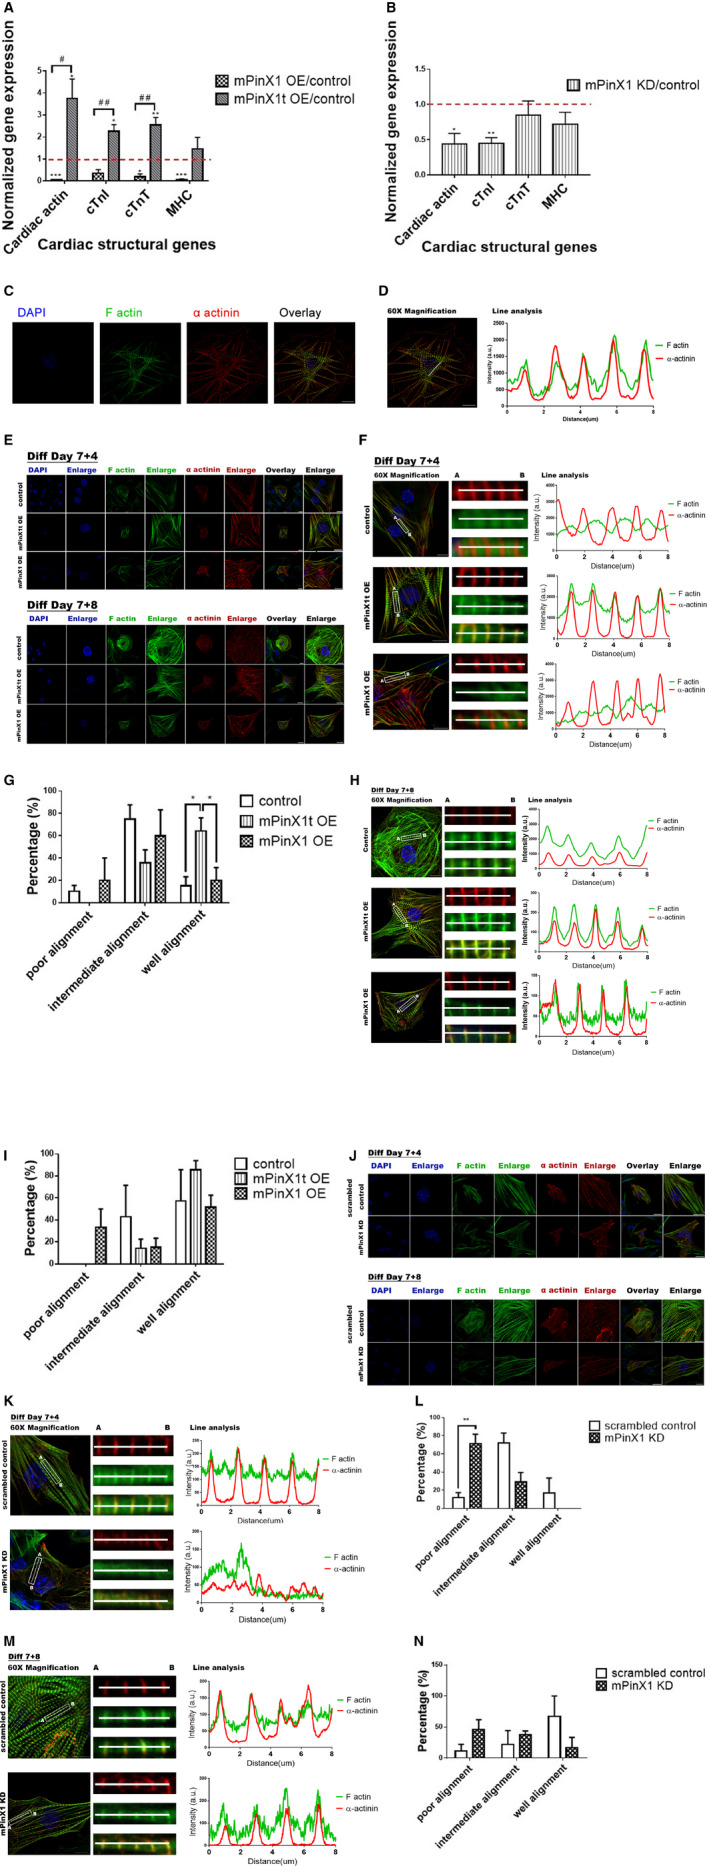
Figure 3.

Effects of the overexpression and knockdown of mPinX1/mPinX1t on cardiac differentiation and sarcomere assembly. A, Bar chart showing the change in expressions of cardiac actin, cTnI, cTnT), and myosin heavy chain (MHC) of cells on differentiation day 7+25 in mPinX1 and mPinX1t overexpression lines normalized to that of control. Dotted line indicates the expression level of the control line. Overexpression of mPinX1 (mPinX1 OE) decreased while overexpression of mPinX1t (mPinX1t OE) increased the expressions of cardiac structural genes. Data were presented as mean±SEM (mPinX1 OE group, n=3; mPinX1t OE group, n=5; control group, n=5; where n represents data from each independent differentiations). *P<0.05, ***P<0.001 vs control line. # P<0.05, ## P<0.01 vs mPinX1 overexpression line. B, Bar chart showing the change in expressions of cardiac actin, cTnI, cTnT, and MHC of cells on differentiated day 7+25 in mPinX1 knockdown line normalized to that of control. Dotted line indicates the expression level of the control line. Knockdown of mPinX1 (mPinX1 KD) decreased the expression of cardiac structural genes. Data were presented as mean±SEM (n=3; where n represents data from each independent differentiations). *P<0.05, **P<0.01 vs control line. C, Immunostaining of α‐actinin and F‐actin of differentiation day 7+12 cardiomyocyte reveals proper sarcomere formation when cardiomyocytes are mature. Scale bar: 10 μm. D, Line analysis showing α‐actinin and F‐actin patterns of differentiation day 7+12 cardiomyocyte in (C). Mature cardiomyocytes have overlapping pattern of α‐actinin and F‐actin. Scale bar: 10 μm. E, Representative immunostaining results of α‐actinin and F‐actin of cardiomyocytes at early differentiation time point (day 7+4) and intermediate differentiation time point (day 7+8) in control line, mPinX1t overexpression line and mPinX1 overexpression line. Scale bar: 20 μm for photos of overlay views and 10 μm for photos with enlarged views. F, Line analysis of cardiomyocytes at early differentiation time point (day 7+4) in control line, mPinX1t overexpression line and mPinX1 overexpression line shown in (E). Scale bar: 10 μm. G, Bar graph summarizing the effects of mPinX1 and mPinX1t overexpression on sarcomere assembly at early differentiation time point (day 7+4). mPinX1t overexpression cell line showed a higher percentage of cardiomyocytes with a well‐aligned α‐actinin and F‐actin pattern, while it did not have cardiomyocytes with poor alignment. Data were presented as mean±SEM (15 cardiomyocytes from mPinX1 OE group, 19 cardiomyocytes from mPinX1t OE group, and 19 cardiomyocytes from control group were analyzed. Cells were obtained from 3 independent differentiations. The unit of statistical analysis was the number of independent differentiations). *P<0.05. H, Line analysis of cardiomyocytes at intermediate differentiation time point (day 7+8) in control line, mPinX1t overexpression line and mPinX1 overexpression line shown in (E). Scale bar: 10 μm. I, Bar graph summarizing the effects of mPinX1 and mPinX1t overexpression on sarcomere assembly at intermediate differentiation time point (day 7+8). Control, mPinX1 overexpression and mPinX1t overexpression cell lines all had >50% cardiomyocytes showing a well‐aligned α‐actinin and F‐actin pattern. The mPinX1t overexpression cell line had a trend of having higher percentage of cardiomyocytes with a well‐aligned α‐actinin and F‐actin pattern. The mPinX1 overexpression cell line had cardiomyocytes with poorly aligned α‐actinin and F‐actin pattern, while mPinX1t overexpression cell line or the control line did not have cardiomyocyte with poor alignment. Data were presented as mean±SEM (19 cardiomyocytes from mPinX1 OE group, 20 cardiomyocytes from mPinX1t OE group, and 19 cardiomyocytes from control group were analyzed. Cell were obtained from 3 independent differentiations. The unit of statistical analysis was the number of independent differentiations.). J, Representative immunostaining results of α‐actinin and F‐actin of cardiomyocytes at early differentiation time point (day 7+4) and intermediate differentiation time point (day 7+8) in scrambled control line and mPinX1 knockdown line. Scale bar: 20 μm for photos of overlay views and 10 μm for photos with enlarged views. K, Line analysis of cardiomyocytes at early differentiation time point (day 7+4) in scrambled control line and mPinX1 knockdown line shown in (J). Scale bar: 10 μm. L, Bar graph summarizing the effects of mPinX1 knockdown on sarcomere assembly at early differentiation time point (day 7+4). mPinX1 knockdown cell line showed a higher percentage of cardiomyocytes with poorly aligned α‐actinin and F‐actin pattern, while it did not have cardiomyocytes with good alignment. Data were presented as mean±SEM (17 cardiomyocytes from the mPinX1 KD group and 18 cardiomyocytes from the scrambled control group were analyzed. Cells were obtained from 3 independent differentiations. The unit of statistical analysis was the number of independent differentiations.). **P<0.01. M, Line analysis of cardiomyocytes at intermediate differentiation time point (day 7+8) in scrambled control line and mPinX1 knockdown line shown in (J). Scale bar: 10 μm. N, Bar graph summarizing the effects of mPinX1 knockdown on sarcomere assembly at intermediate differentiation time point (day 7+8). mPinX1 knockdown cell line had a trend of having higher percentage of cardiomyocytes with poorly aligned α‐actinin and F‐actin pattern and had a trend of having lower percentage of cardiomyocytes with a well‐aligned α‐actinin and F‐actin pattern. Data were presented as mean±SEM (17 cardiomyocytes from the mPinX1 KD group and 15 cardiomyocytes from the scrambled control group were analyzed. Cells were obtained from 3 independent differentiations. The unit of statistical analysis was the number of independent differentiations.) cTnI indicates cardiac troponin I; cTnT, cardiac troponin T; DAPI 4′,6‐diamidino‐2‐phenylindole.
