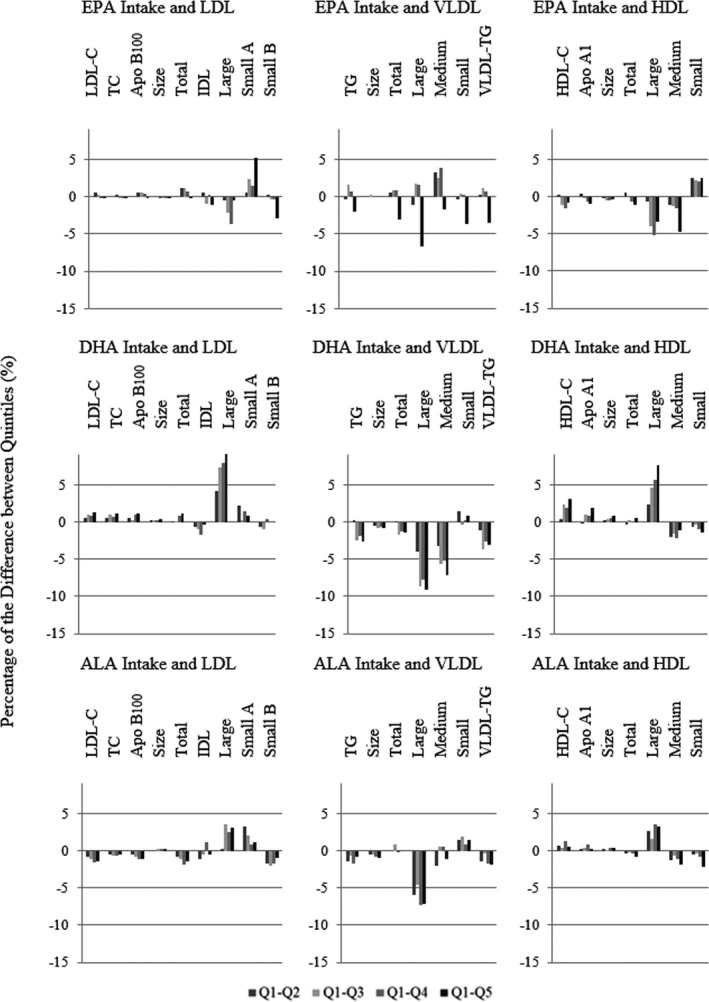
Figure 2.

Adjusted percentage difference in lipids and lipoproteins between quintiles (Qs; Q2–Q5) compared with Q1 of n‐3 subtype intakes. ALA indicates α‐linolenic acid; Apo, apolipoprotein; DHA, docosahexaenoic acid; EPA, eicosapentaenoic acid; HDL, high‐density lipoprotein; HDL‐C, high‐density lipoprotein cholesterol; IDL, intermediate‐density lipoprotein; LDL, low‐density lipoprotein; LDL‐C, low‐density lipoprotein cholesterol; n‐3, omega‐3; TC, total cholesterol; TG, triglycerides; VLDL, very‐low‐density lipoprotein.
