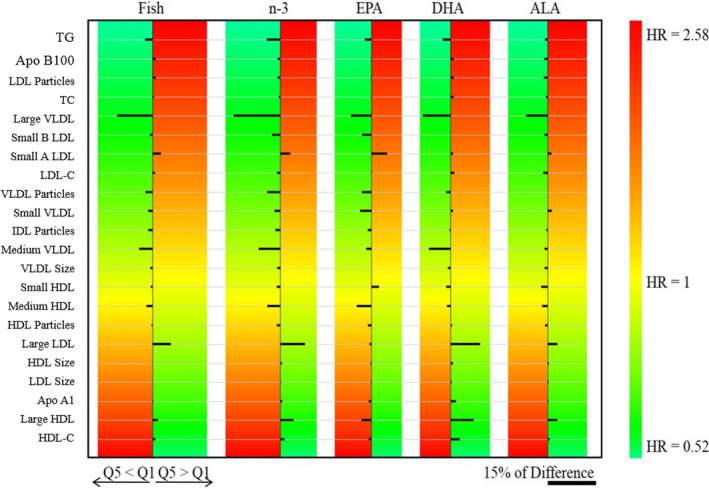
Figure 3.

Heat map of percentage differences between adjusted means of greater and lower intake groups of the exposure variables (Q5–Q1) according to intake of fish, total n‐3, and n‐3 subtypes. Outcome variables are sorted according to previously reported hazard ratios (HRs) adjusted for nonlipid risk factors. Green is associated with lower risk of cardiovascular disease (CVD), and red is associated with higher risk of CVD. The right‐lower scale bar illustrates the magnitude (length) of a 15% difference between Q5 and Q1, in which smaller bars represent <15% difference and larger bars represent >15% difference. When the consumption of higher amounts of exposure variables decreases the outcome variable, Q5<Q1; when the consumption of higher amounts of exposure variables increases the outcome variable, Q5>Q1 (fish: Q1, n=5839; Q5, n=5617; n‐3: Q1, n=5248; Q5, n=5123; EPA: Q1, n=5370; Q5, n=4947; DHA: Q1, n=6351; Q5, n=4797; ALA: Q1, n=5286; Q5, n=5097). ALA indicates α‐linolenic acid; Apo, apolipoprotein; DHA, docosahexaenoic acid; EPA, eicosapentaenoic acid; HDL, high‐density lipoprotein; HDL‐C, high‐density lipoprotein cholesterol; IDL, intermediate‐density lipoprotein; LDL, low‐density lipoprotein; LDL‐C, low‐density lipoprotein cholesterol; n‐3, omega‐3; Q, quintile; TC, total cholesterol; VLDL, very‐low‐density lipoprotein.
