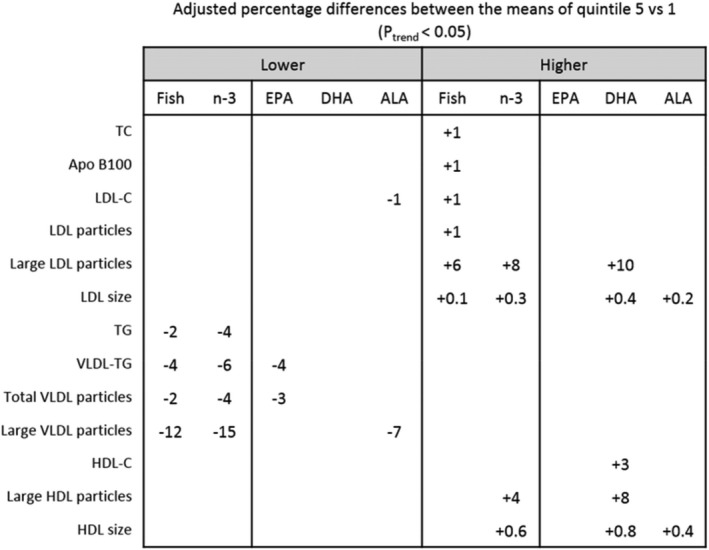
Figure 4.

Percentage differences between the means of the greater and lower intake groups of the exposure variables (Q5–Q1) after adjusting for all demographic, clinical, and dietary factors that showed a significant association (P Trend<0.05) among fish, total n‐3, and the different n‐3 subtypes of fatty acid intake and lipid and lipoprotein subfractions. Blank spaces indicate no significant association (fish: Q1, n=5839; Q5, n=5617; n‐3: Q1, n=5248; Q5, n=5123; EPA: Q1, n=5370; Q5, n=4947; 6 DHA: Q1, n=6351; Q5, n=4797; ALA: Q1, n=5286; Q5, n=5097). ALA indicates α‐linolenic acid; Apo, apolipoprotein; DHA, docosahexaenoic acid; EPA, eicosapentaenoic acid; TC, total cholesterol; LDL, low density lipoprotein; LDL‐C, low‐density lipoprotein cholesterol; TG, triglycerides; VLDL, very‐low‐density lipoprotein; HDL, high‐density lipoprotein; HDL‐C, high‐density lipoprotein cholesterol. For the adjusted means please see Table S14.
