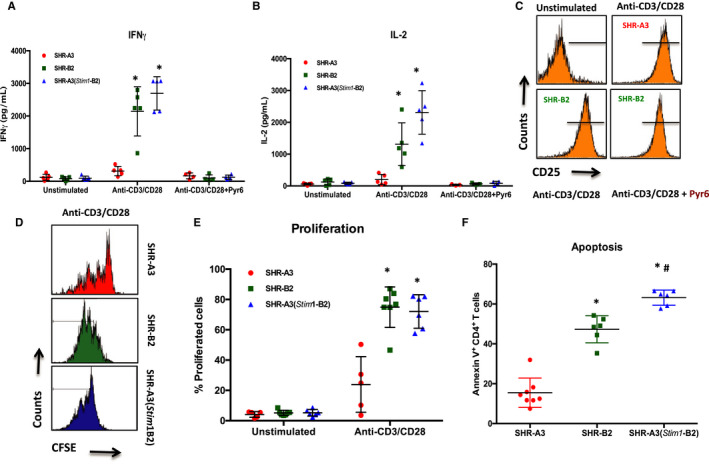
Figure 5.

Effect of the Stim1 mutation on CD4+ T‐cell function. Quantification of (A) IFNγ and (B) IL‐2 production by CD4+ T cells from SHR‐A3, SHR‐B2, and SHR‐A3(Stim1‐B2) rats in response to anti‐CD3/anti‐CD28 costimulation for 24 hours under nonpolarizing conditions. A subset of cells was pretreated with the ORAI1 channel blocker Pyr6 (5 μmol/L) for 15 minutes before the addition of CD28. C, Upregulation of the activation marker CD25 on CD4+ T cells after 18 hours of TCR stimulation with anti‐CD3/anti‐CD28. Pretreatment of T cells with Pyr6 did not prevent CD25 expression. Data are representative of 3 independent experiments. D, Histograms showing the intensity peaks of CFSE as an indicator of CD4+ T‐cell proliferation in response to TCR stimulation using anti‐CD3/anti‐CD28 for 72 hours in (upper panels) SHR‐A3, and (lower panels) SHR‐B2 and SHR‐A3(Stim1‐B2) cells. Each peak represents 1 cell division in stimulated cells. E, Summary graph of total percentage of CD4+ T cells undergoing at least 1 cell division. F, Summary graph of Annexin V+ CD4+ T cells from SHR‐A3, SHR‐B2, and SHR‐A3(Stim1‐B2) rats in response to 24‐hour restimulation with anti‐CD3/anti‐CD28 after the initial 72‐hour TCR stimulation with anti‐CD3 and anti‐CD28. *P<0.05 vs SHR‐A3 and # P<0.05 vs SHR‐B2 with n=6 per group. CFSE indicates carboxyfluorescein succinimidyl ester; IFNγ, interferon‐γ; IL‐2, interleukin‐2; TCR, T‐cell receptor.
