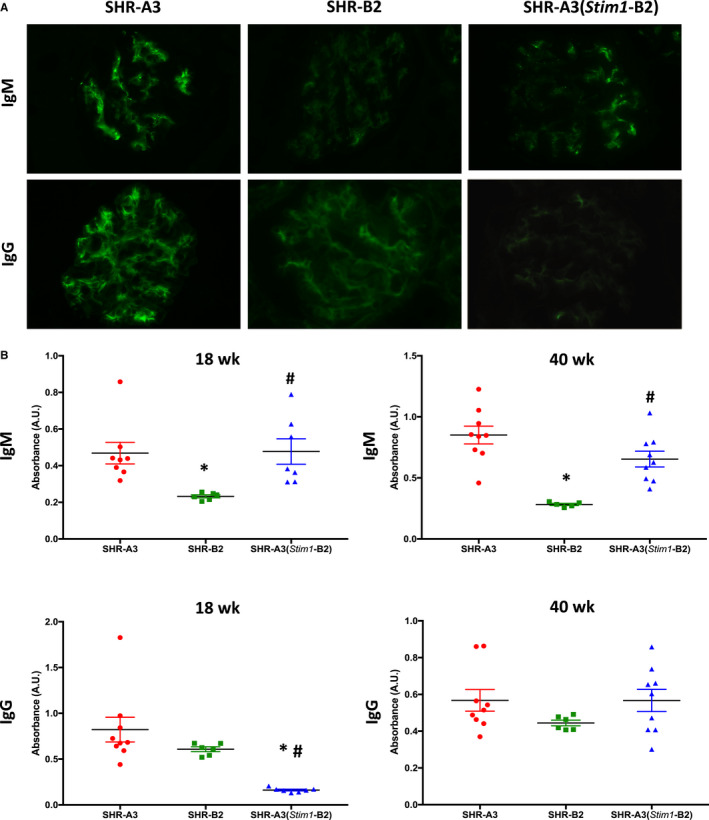
Figure 6.

Renal IgM and IgG in SHR‐A3, SHR‐B2, and SHR‐A3(Stim1‐B2). A, Representative images of immunofluorescent detection of IgM (upper panels) and IgG (lower panels) in kidneys from 40‐week‐old SHR‐A3, SHR‐B2, and SHR‐A3(Stim1‐B2) rats; n=5 to 6 rats. Original magnification ×400 and with an exposure time of 500 ms for all images. B, Serum ELISAs of anti–ds‐DNA for IgM (upper panels) and IgG (lower panels) in 18‐ and 40‐week‐old SHR‐A3, SHR‐B2, and SHR‐A3(Stim1‐B2) rats; n=9 (SHR‐A3), 6 (SHR‐B2), 9 (SHR‐A3[Stim1‐B2]). *P<0.05 vs SHR‐A3 and # P<0.05 vs SHR‐B2.
