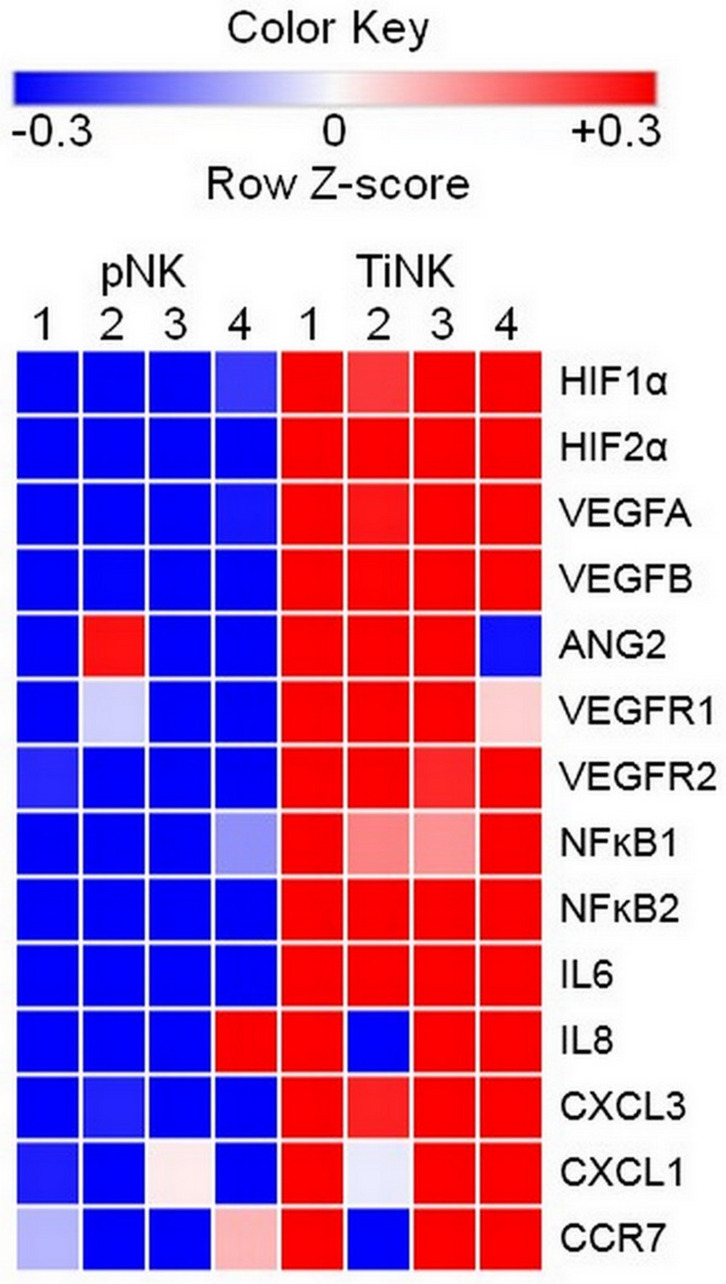
Figure 3. RCC TiNK cells have an altered transcriptional profiled compared to patient matched pNK cells.
NK cells isolated from peripheral blood or RCC tumor tissues of 4 patients were isolated of total RNA and RT-qPCR analysis of the indicated targets performed in triplicate. Heat maps of transcriptional changes were developed for calculated Z-scores. Each row corresponds to the listed gene and columns to an individual patient (1–4) with source of NK cells peripheral blood (pNK) or RCC tumor (TiNK) indicated at the top. Scale bar with pseudocolors denotes differential gene expression: blue and red indicate low and high expression, respectively; white indicates no change in expression levels.

