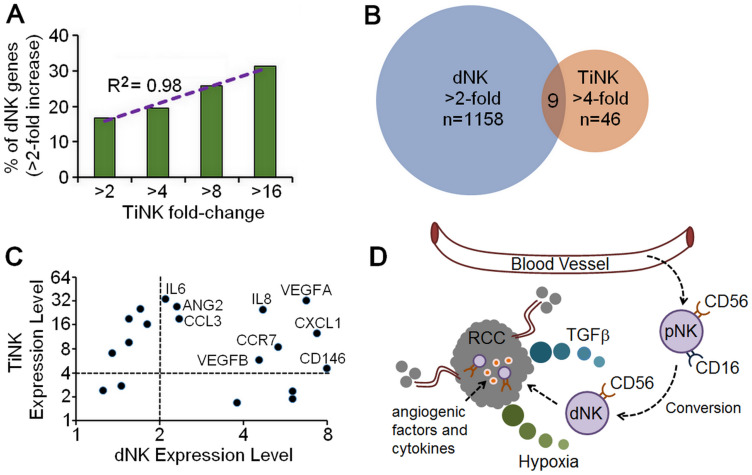
Figure 5. Similarities in gene expression for RCC TiNK and dNK cells.
(A) Comparison of genes from a published microarray analysis for purified dNK cells [5] with any increase from the minimum hybridization threshold of 20 plotted against genes increased by 2-, 4-, 8-, or 16-fold by RT-qPCR analysis of TiNK cells with regression analysis. (B) Venn diagram of gene expression data for dNK cells (microarray data, >2-fold increase) versus RCC TiNK cells (RT-qPCR data, >4-fold increase). (C) Genes with any increase above the minimum hybridization threshold of 20 for dNK cells plotted against matched counterparts for TiNK cells with genes demonstrating > 2-fold increase for dNK and >4-fold increase for RCC TiNK labeled. (D) Schematic diagram of potential role for CD56+CD16-/dim dNK-like cells in RCC tumor development and metastasis. The noncytotoxic dNK-like cells are converted from pNK phenotype in the tumor environment when encountering low oxygen (hypoxia) and/or TGFβ. This results in loss of cytotoxic function and production of angiogenic factors and cytokines supporting tumor growth and metastasis.

