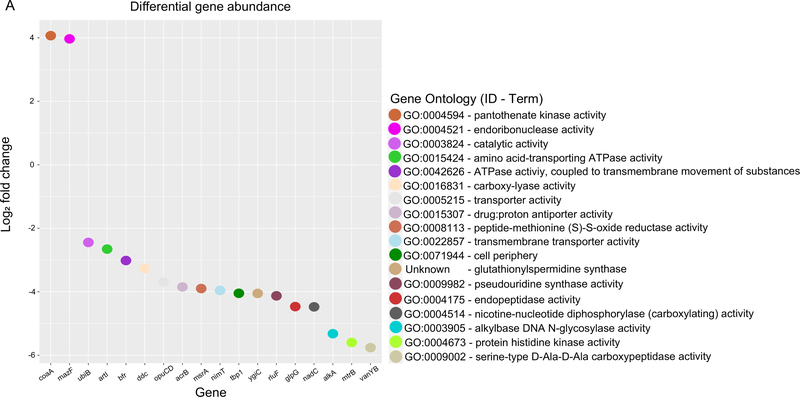
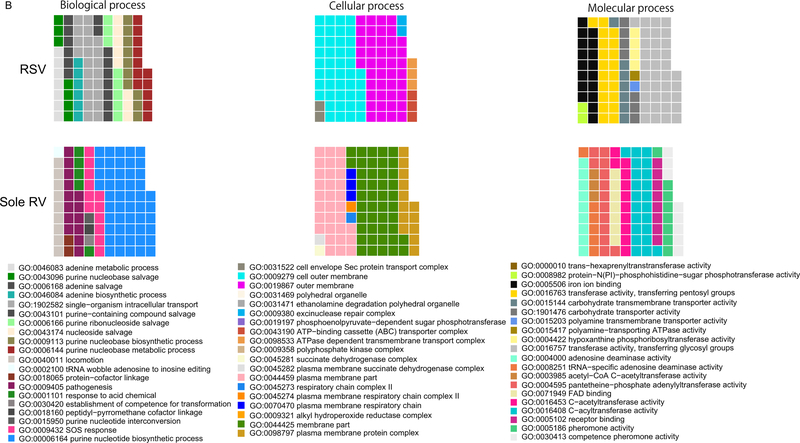
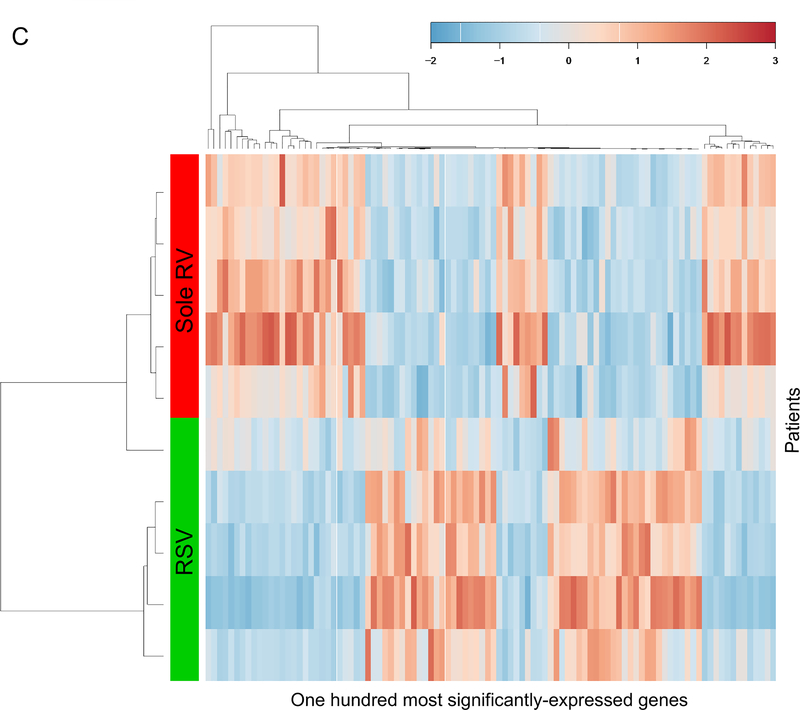
FIGURE 1. Nasopharyngeal airway microbiome function and host response between five respiratory syncytial virus and five sole rhinovirus bronchiolitis.
A. Microbial gene abundance. Differential microbial gene expression in the nasopharyngeal airway between the RSV and sole RV groups. Upregulated genes in the RSV group are represented by positive log2 fold changes, while upregulated genes in the sole RV group are represented by negative log2 fold changes. Color represents Gene Ontology terms associated with the genes.
B. Top Gene Ontology terms of the nasopharyngeal microbiome. The waffle plots show the top ontology (biological process, cellular component, and, molecular function) terms within each of the two groups. The number of squares indicates the importance of the function within each group. The majority of the enriched terms differ between the groups.
C. Unsupervised hierarchical clustering of the 100 most differentially-expressed host genes. The gene expression profiles separated infants with RSV bronchiolitis from those with sole RV bronchiolitis. The color bar indicates the standardized expression of each gene to a mean of 0. Upregulated genes have positive values and are displayed as red. Downregulated genes have negative values and are displayed as blue. The differences in gene expression between RSV and sole RV are summarized in Supplemental Table S3.
Abbreviations: RSV, respiratory syncytial virus; RV, rhinovirus


