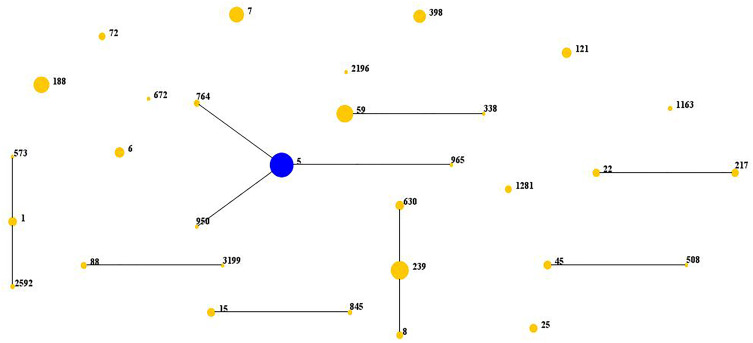
Figure 1.
Distribution of sequence types (STs) in the clone complexes.
Notes: The diagram generated by eBURST based on the MLST data of this study, representing the relationships of the 302 S. aureus isolates. Each number is on behalf of an ST, STs that are linked by lines belong to the same clone complexes. The diameter of the circle stands for the number of the same ST isolates.

