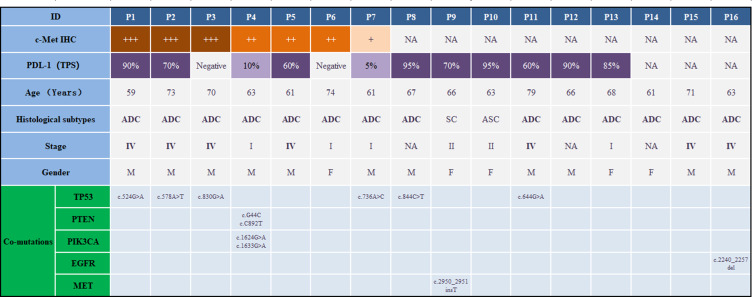
Figure 3.
C-MET IHC, PD-L1 expression status, and co-mutations profile in patients harboring the MET exon 14 mutations. Patient ID are shown in the first line. The stage of presentation is indicated, and patients with stage IV are highlighted in bold. c-MET staining is shown in brown and the intensity represents the expression status. PD-L1 expression is indicated similarly. Patients with high expression of PD-L1 is shown in dark purple, while low expression is shown in light purple.

