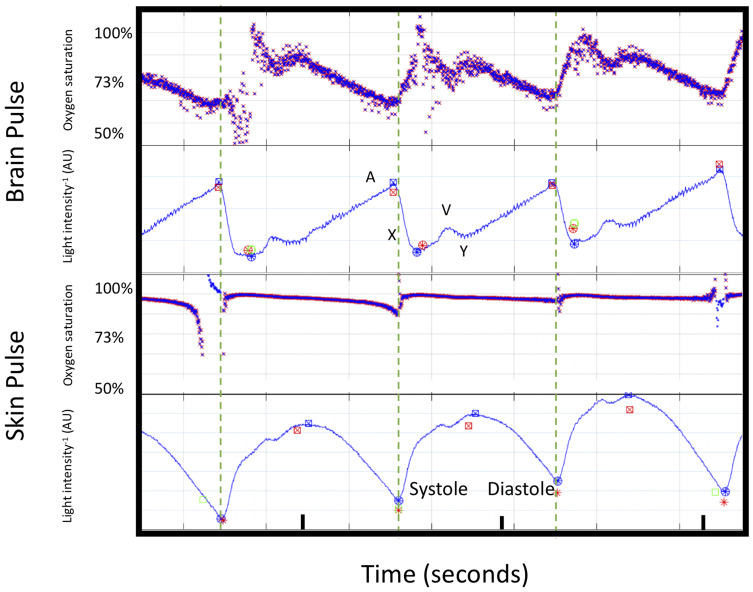
Figure 3.
Cardiac cycle changes in oxygen saturations and PPG waveforms (660 nm wavelength shown) for the brain and forehead skin pulse oximeter during normoxia from subject 3. The blood oxygen saturations are demonstrated on the Y axis. The dashed line demonstrates the start of each skin PPG waveform. The brain oximeter oxygen saturations peaked during systole, with a second lower peak during early diastole. Thereafter, oxygen saturations fell. The skin oxygen saturations remained stable throughout the cardiac cycle. The large changes in the brain oximeter oxygen saturations are consistent with the signal arising from microcirculation blood. The changes in the skin are consistent with shunting, and blood bypassing the capillaries.
Abbreviation: AU, arbitrary units.

