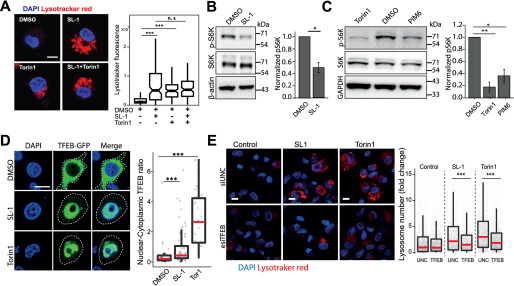
Figure 5.
SL-1 from M. tuberculosis influences lysosomal biogenesis in host cells via mTORC1-dependent nuclear translocation of the TFEB. A, THP-1 monocyte-derived macrophages were treated with DMSO/SL1/Torin1/SL1+Torin1 comparing LysoTracker staining levels between the different conditions. Representative images and quantification of cells treated with 25 μg/ml of SL-1 and 1 μm Torin1. Approximately 100 cells were analyzed per category in each experiment and significance was assessed by Mann-Whitney test. The data presented are representative of two independent experiments. B and C, immunoblots and quantification of phosphorylated and total levels of indicated proteins in THP-1 monocyte-derived macrophage lysates treated with DMSO (control) or SL-1 (B) or PIM6 (C). Torin1 (1 μm) was used as a positive control. Bar graphs show average of at least three biological replicates and error bars represent S.D. Change in the phosphorylation status of the indicated protein (S6 kinase, Thr-389) was assessed by normalizing phosphorylated protein to the respective total protein. Actin/GAPDH was used as the loading control. Significance is assessed using unpaired one-tailed Student's t test with unequal variance, * represents p value less than 0.05 and ** less than 0.01. D, RAW macrophages were transfected with TFEB-GFP for 24 h and treated with 25 μg/ml of SL-1 or negative and positive controls, DMSO and Torin1 (250 nm for 24 h), respectively. Representative images and quantification of nuclear to cytoplasmic ratio of TFEB-GFP between the different conditions are shown. Results are representative of at least three independent experiments. E, THP-1 monocyte-derived macrophages were transfected with either control siRNA (Universal negative control 1, UNC1) or TFEB siRNA for 48 h followed by treatment with SL-1 (25 μg/ml for 24 h) or Torin1 (1 μm for 4 h) and were pulsed with LysoTracker Red and imaged. Representative images and quantification of control, SL-1, and Torin1 treatment in UNC1 or TFEB siRNA-transfected macrophages are shown. Results are representative of two biological experiments. Statistical significance for A, D, and E was assessed using Mann-Whitney test, *** denotes p value of less than 0.001 and n.s. represents nonsignificant. Scale bar is 10 μm. For A, D, and E, data are represented as box plot. Individual data points overlaid on the box plot in D and E represent single cells.

