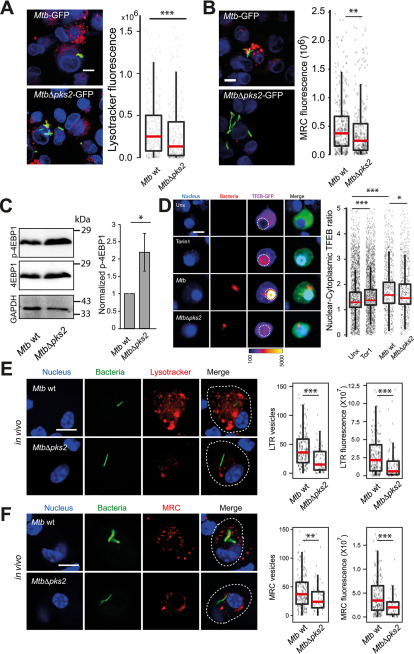
Figure 6.
M. tuberculosis SL-1 influences lysosomal biogenesis in both in vitro and in vivo infection via mTORC1-dependent nuclear translocation of the TFEB. A and B, THP1 monocyte-derived macrophages were infected with Mtb WT and MtbΔpks2 M. tuberculosis-GFP CDC1551 for 48 h and stained with different lysosome probes, namely LysoTracker Red (A) and MRC (B). Images and graphs in A and B show a comparison of the total lysosomal intensities of the respective probes in individual Mtb WT and MtbΔpks2 mutant-infected cells. C, THP1 monocyte-derived macrophages were infected with Mtb WT or MtbΔpks2 CDC1551 for 48 h and lysates were immunoblotted for mTORC1 substrate 4EBP1. Immunoblots and quantification of phosphorylated and total 4E-BP1 are shown. GAPDH is used as loading control. Results represent the average and S.E. of four biological experiments. D, RAW macrophages were transfected with TFEB-GFP followed by 4 h infection with Mtb WT or MtbΔpks2 CDC1551. Cells were fixed 4 hpi, imaged, and nuclear to cytoplasmic ratio of TFEB-GFP was compared between unexposed, Torin1 treated, WT, and pks2 mutant-infected cells. Torin1 treatment (250 nm for 4 h) was used as positive control. TFEB-GFP channel images are shown in Fire LUT for better visualization of the fluorescence intensities. Each data point represents the nuclear cytoplasmic ratio of TFEB intensity from an individual cell. Data points are pooled from two independent biological experiments. E and F, C57BL/6NJ mice were infected with Mtb WT or MtbΔpks2 CDC1551 by aerosol inhalation. Eight weeks post-infection, macrophages were isolated from infected lungs from single-cell suspension and were pulsed with LysoTracker Red (E) or MRC (F). The number and intensity of lysosomes in respective probes were compared between Mtb WT or MtbΔpks2 CDC1551-infected cells. Results are compiled from four WT Mtb and three Δpks2 CDC1551-infected mice and are representative of two independent infections. Statistical significance for A, B, and D–F was assessed using Mann-Whitney test, * denotes p value of less than 0.05, ** denotes p-value of less than 0.01 and *** denotes p value of less than 0.001. Scale bar is 10 μm. For A, B, and D–F, data are represented as box plots, with the median denoted by a red line. Individual data points corresponding to single cells are overlaid on the box plot.

