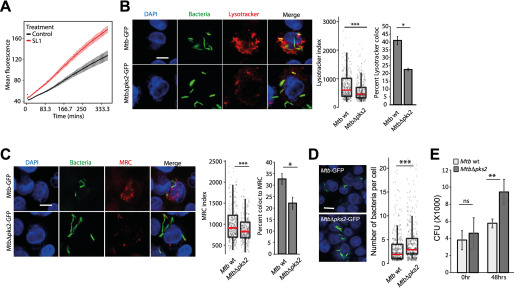
Figure 7.
SL-1 alters phagosome maturation kinetics and survival of intracellular Mtb. A, RAW macrophages were infected with pHrodo Red-labeled E. coli and treated with SL-1. pHrodo Red fluorescence intensity was measured in a kinetic mode using a microplate reader. Mean ± S.D. from at least 4 wells for each condition is plotted. Results are representative of two biological replicates. The differences between control and SL-1 are statistically significant as assessed by unpaired one-tailed Student's t test with unequal variance. B and C, lysosomal delivery of WT and MtbΔpks2 CDC1551 following infection in THP1 monocyte-derived macrophages and lysosomal labeling with LysoTracker Red (B) or Magic Red cathepsin (C). Graphs show object-based colocalization of bacterial phagosomes with lysosomes stained with the respective lysosomal probes and quantified by two different methods as described under “Experimental procedures.” Bacteria overlapping by more than 50% with the lysosomal compartment were considered co-localized (shown in B and C, bar graphs). More than 1000 phagosomes were analyzed in each experiment for colocalization analysis. Results are average of three biological experiments and S.E. between the biological replicates. LysoTracker (B) and MRC (C) index represent the intensity of the respective lysosomal probe in the mycobacterial phagosome. D, bacterial counts from WT or MtbΔpks2-infected THP-1 monocyte-derived macrophages 48 hpi. Cells and bacteria were segmented and counted as described under “Experimental procedures.” Each dot is a single infected cell, the median value of the data set indicated by red line and spread as indicated by the box plot. Results are representative of at least three independent biological replicates. E, CFUs of Mtb WT or MtbΔpks2 CDC1551-infected THP1 monocyte-derived macrophages immediately after infection and 48 hpi. Results are the average and S.E. of data compiled from three biological experiments, each containing four technical replicates. Scale bars are 10 μm, data are represented as box plots, with individual data points corresponding to single cells overlaid. Statistical significance for bar graphs in B, C, and E is assessed using unpaired-one tailed Student's t test with unequal variance, * represents p value less than 0.05, ** less than 0.01, and n.s. represents nonsignificant. Statistical significance for box plots in B–D was assessed using Mann-Whitney test, *** denotes p value of less than 0.001. Data are represented as box plots, with the median denoted by red line. Individual data points corresponding to single cells are overlaid on the box plot.

