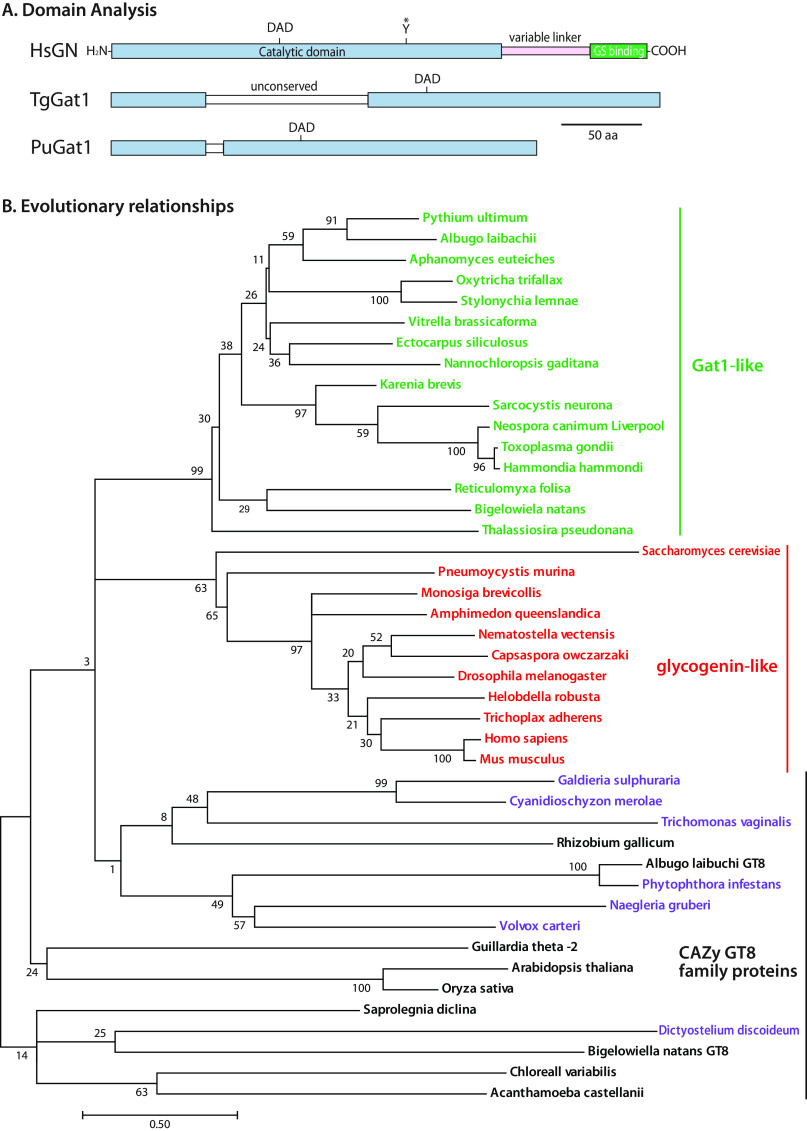
Figure 3.
Gat1 is closely related to glycogenin sequences. A, domain analysis of Gat1 from T. gondii and P. ultimum compared with human glycogenin-1. B, the evolutionary history of the sequence of the Gat1 catalytic domain was inferred by using a maximum likelihood method. The tree with the highest log likelihood (−13,279.56) is shown. Gat1 and Gat1-like sequences are colored green, glycogenin and glycogenin-like sequences are in red, and characterized and other selected other CAZy GT8 sequences are in black, or in purple if predicted to reside in the secretory pathway rather than the cytoplasm. The percentage of trees in which the associated taxa clustered together is shown at each branch. Branch lengths are measured by the number of substitutions per site. See Figs. S6–S8 for alignments.

