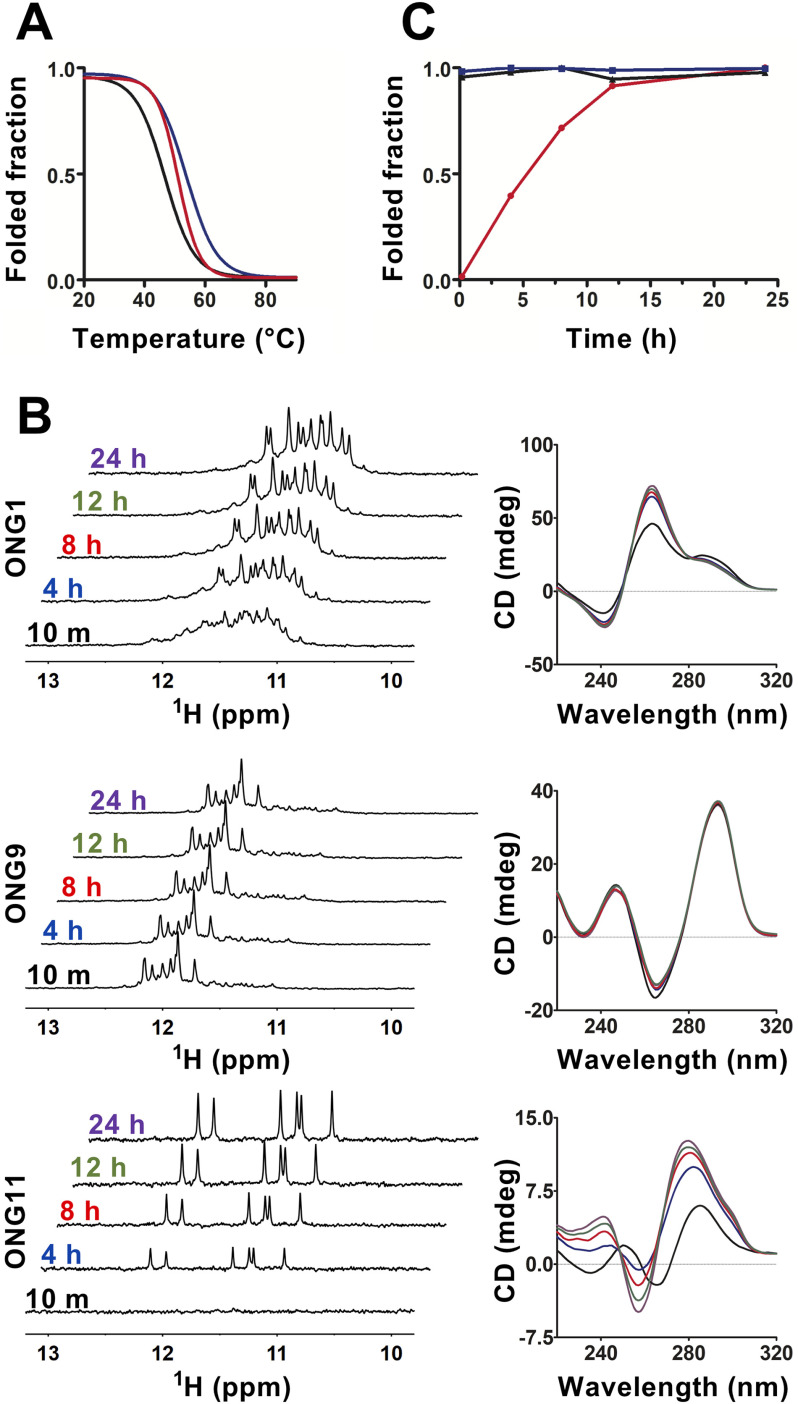
Figure 2.
Non-B DNA structures in long and short telomeric G-overhangs have notably distinct formation kinetics. A, normalized CD melting curves for ONG1 (black; apparent Tm = 46.3 °C), ONG9 (blue; apparent Tm = 53.5 °C), and ONG11 (red; apparent Tm = 50.7 °C). B, imino region of 1D 1H NMR (left) and CD (right) spectra of ONG1, ONG9, and ONG11 acquired as a function of time (time points indicated). The NMR and CD spectra were measured in K+S buffer at a DNA concentration of 50 μm. NMR spectra were acquired using a zggpw5 pulse sequence (see “Experimental procedures”). C, time course of the folding process for ONG1 (black, triangle), ONG9 (blue, square), and ONG11 (red, circle) as estimated from the normalized time-dependent changes of imino signals in NMR spectra presented in A.

