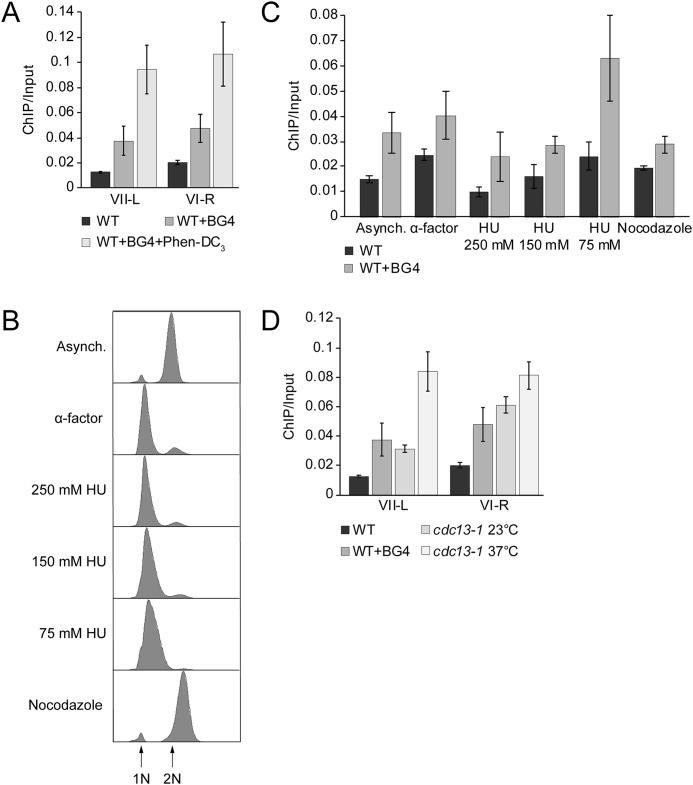
Figure 6.
Formation of telomeric G-quadruplexes changes during the cell cycle in S. cerevisiae. A–D, formation of G4 at telomeres was monitored by BG4 ChIP and analyzed by qPCR. G4 levels were detected in WT yeast cells. A, BG4 ChIP and qPCR analysis at two different telomeres (telomere VII-L and VI-R). As control, ChIP and qPCR were performed in the absence of BG4 antibody and 10 μm Phen-DC3 to determine the specific binding of BG4. Data were normalized to input material (ChIP/Input). B, FACS analysis of yeast strains to monitor the arrest in specific cell cycle phases. Cells were arrested in G1 phase with α factor for 3 h. For different S-phase time points, cells were released from G1 in the presence of the indicated concentrations of HU (early S, 250 mm HU; mid-S phase, 150 mm HU; and late S phase, 75 mm HU). For G2 phase, cells were treated with 15 µg/ml nocodazole for 2 h. C, BG4 ChIP and qPCR analysis to monitor G4 levels in different cell cycle phases at telomere VII-L. BG4 ChIP signals were normalized to input. Plotted are the means of at least three biological replicates. Error bars represent SEM. Significance was calculated based on Student's t test comparing 75 mm HU with the other cell cycle phases. G4 level at 75 mm HU compared with other cell cycle phases was significantly higher according to the t test (p < 0.02). Only in G1 arrest (α factor), a significance of p = 0.1 was calculated. D, BG4 ChIP and qPCR analysis at two different telomeres (telomere VII-L and VI-R) in cdc13-1 mutant at nonpermissive temperature (37 °C). As control, the BG4 ChIP was done in cdc13-1 mutant at permissive temperature (23 °C) and WT strain. We observed 5-6-fold higher enrichment of telomeric G4s in cdc13-1 strain at nonpermissive temperature compared with WT. Data were normalized to input material (ChIP/Input).

