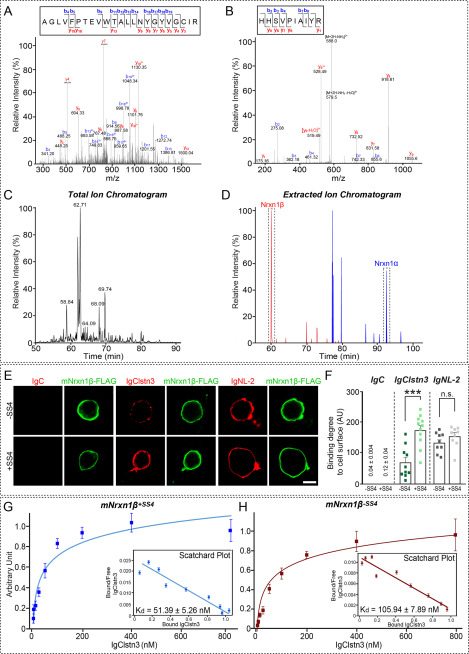
Figure 1.
Analysis of Clstn3–β-Nrxn interactions by MS and cell surface-binding assays. A and B, MS/MS spectra of two double-charged peptides unique to Nrxn1α and Nrxn1β at m/z 867.11 and 596.33, respectively, were obtained by liquid chromatography (LC)-MS/MS and fragmented to produce MS/MS spectra with b- and y-ion series describing the sequences AGLVFPTEVWTALLNYGYVGCIR (aa 501–523) and HHSVPIAIYR (aa 64–73). C and D, MS data. C, total ion chromatogram (XIC) of tryptic digests of Ig-Clstn3–bound eluates separated by LC. D, extracted ion chromatograms of m/z 867.11 and 596.33 ions from Nrxn1α (92.8 min) and Nrxn1β (60.1 min), respectively. E, cell surface-binding assays. HEK293T cells expressing C terminally FLAG-tagged mouse Nrxns were incubated with purified Ig-fused neuroligin-2 (IgNL-2), calsyntenin-3 (IgClstn3), or negative control (IgC) and analyzed by immunofluorescence imaging for Ig-fusion proteins (red) and FLAG (green). All binding reactions were performed in 2 mm CaCl2 and 2 mm MgCl2. Scale bars: 10 μm (applies to all images). F, quantification of cell surface binding in E. Data are mean ± S.E. (***, p < 0.001; nonparametric Mann-Whitney U test; number of cells analyzed = 9–11). p value for IgC binding: Nrxn1β-SS4 versus Nrxn1β+SS4, p = 0.0630, p value for IgC binding: Nrxn1β-SS4 versus Nrxn1β+SS4, p = 0.0003. p value for IgClstn3 binding: Nrxn1β-SS4 versus Nrxn1β+SS4, p = 0.1903. p value for IgNL-2 binding: Nrxn1β-SS4 versus Nrxn1β+SS4, p = 0.0630. G and H, saturation binding of IgClstn3 to FLAG-tagged mouse Nrxn1β+SS4 (G) or Nrxn1β-SS4 (H) expressed in HEK293T cells. Inset: Scatchard plot generated by linear regression of the data; Kd was calculated from three independent experiments. Data are mean ± S.E.

