Figure 4.
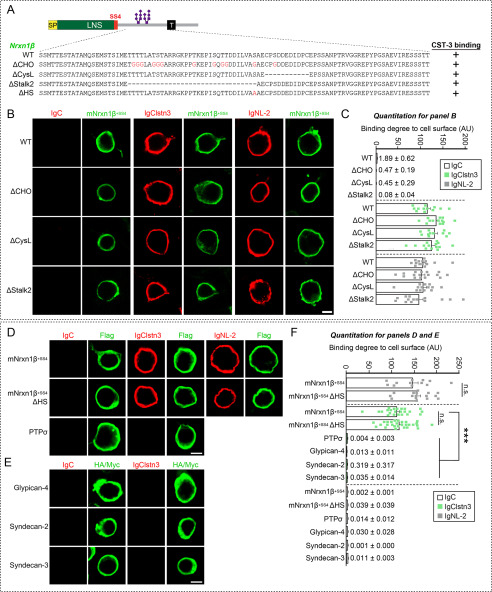
No Effect of Nrxn1β O-glycosylation on Clstn3–Nrxn1β interactions. A, diagrams of Nrxn1 constructs used in the cell surface–labeling assays presented in B. B, cell surface–labeling assays. HEK293T cells expressing FLAG-tagged Nrxn1β+SS4 WT or its deletion variants (ΔCHO, ΔCysL, or ΔStalk2) were incubated with IgC (control), IgClstn3, or IgNL-2 and analyzed by immunofluorescence imaging for Ig-fusion proteins (red) and FLAG (green). All binding reactions were performed in 2 mm CaCl2 and 2 mm MgCl2. Scale bars: 10 μm for all images. C, quantification of cell-surface binding in B. Data are mean ± S.E. (number of cells analyzed = 11–16). p values for IgC binding: WT versus ΔCHO, p = 0.0816; WT versus ΔCysL, p = 0.1732; WT versus ΔStalk2, p = 0.0651. p value for IgClstn3 binding: WT versus ΔCHO, p = 0.0724; WT versus ΔCysL, p = 0.4738; WT versus ΔStalk2, p > 0.9999. p values for IgNL-2 binding: WT versus ΔCHO, p > 0.9999; WT versus ΔCysL, p > 0.9999; WT versus ΔStalk2, p > 0.9999. D, cell surface–labeling assays. HEK293T cells expressing FLAG-tagged Nrxn1β+SS4 WT, its heparan sulfate binding defective mutant (ΔHS), or PTPσ were incubated with IgC (control), IgClstn3, or IgNL-2 and analyzed by immunofluorescence imaging for Ig-fusion proteins (red) and FLAG (green). All binding reactions were performed in 2 mm CaCl2 and 2 mm MgCl2. Scale bars: 10 μm for all images. E, cell surface–labeling assays. HEK293T cells expressing HA-tagged Glypican-4, Myc-tagged Syndecan-2, or Syndecan-3 were incubated with IgC (control), or IgClstn3 and analyzed by immunofluorescence imaging for Ig-fusion proteins (red) and HA/Myc (green). All binding reactions were performed in 2 mm CaCl2 and 2 mm MgCl2. Scale bars: 10 μm for all images. F, quantification of cell-surface binding in D and E. Data are mean ± S.E. (number of cells analyzed = 12–28). (***, p < 0.001; nonparametric Kruskal-Wallis test with Dunn's post hoc test). p value for IgNL-2 binding: WT versus ΔHS, p = 0.3713. p value for IgClstn3 binding: WT versus ΔHS, p > 0.9999; WT versus PTPσ, p < 0.0001; WT versus Glypican-4, p < 0.0001; WT versus Syndecan-2, p < 0.0001; WT versus Syndecan-3, p < 0.0001. p values for IgC binding: WT versus ΔHS, p > 0.9999; WT versus PTPσ, p > 0.9999; WT versus Glypican-4, p > 0.9999; WT versus Syndecan-2, p > 0.9999; WT versus Syndecan-3, p = 0.1694.

