Figure 7.
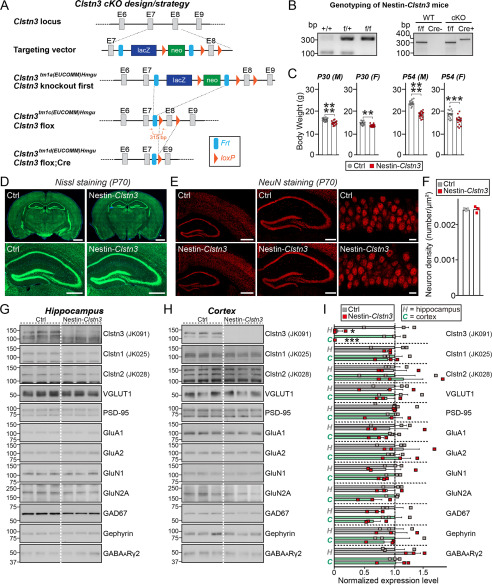
Characterization of Clstn3-cKO mice. A, strategy used to generate conditional Clstn3tm1d/tm1d KO mice. Arrows flanking the neomycin gene and FLP recombinant target (FRT) or exon 8 (E8) indicate loxP sites. Red arrows indicate forward and reverse primers used for genotyping. Note that lacZ and neomycin cassettes are two separate markers. B, PCR genotyping of Nestin-Cre;Clstn3fl/fl (Nestin-Clstn3; cKO). The 400-bp Cre-specific PCR product was detected only in Nestin-Clstn3 mice. The band size of the Clstn3 floxed allele was 315 bp. C, body weight of Nestin-Clstn3 and Clstn3fl/fl (Ctrl) mice at P30 and P54. Abbreviations: F, female; M, male. Data are mean ± S.E. (****, p < 0.0001; ***, p < 0.001; **, p < 0.01; Mann-Whitney U test). p values as follows: P30 (M), Ctrl versus Nestin-Clstn3, p < 0.0001; P30 (F), Ctrl versus Nestin-Clstn3, p = 0.0013; P45 (M), Ctrl versus Nestin-Clstn3, p < 0.0001; P45 (F), Ctrl versus Nestin-Clstn3, p = 0.0001. D, normal gross morphology of the Nestin-Clstn3 brain at P70, as revealed by Nissl staining. Scale bar: 1 mm (top) and 500 μm (bottom). E, representative images of NeuN (a neuronal marker) staining from the Nestin-Clstn3 brain. Normal numbers of neurons (F) in hippocampal and cortical regions (left, forebrain coronal section; middle, hippocampal coronal section; right, hippocampal CA1 stratum pyramidale layer). Scale bar: 1 mm (left), 0.5 mm (middle), and 20 μm (right). F, summary graphs of NeuN (neuron marker) staining from E. Data are mean ± S.E. (Ctrl versus Nestin-Clstn3, p > 0.9999, n = 3 mice each after averaging data from 6 sections/mouse; n.s., not significant). G–I, representative immunoblots for the hippocampus (G) and cortex (H) and summary graphs of synaptic protein levels (I) in crude synaptosomal fractions of P42 Ctrl and Nestin-Clstn3 brains, analyzed by semi-quantitative immunoblotting (equal amounts of protein (30 μg) from crude synaptosomal fractions were loaded). Data are mean ± S.E. (***, p < 0.001; *, p < 0.05; Student's t test; n = 3 mice each group). p values for hippocampus: Clstn3, Ctrl versus Nestin-Clstn3, p = 0.0259; Clstn1, Ctrl versus Nestin-Clstn3, p = 0.5963; Clstn2, Ctrl versus Nestin-Clstn3, p = 0.9662; VGLUT1, Ctrl versus Nestin-Clstn3, p = 0.7262; PSD-95, Ctrl versus Nestin-Clstn3, p = 0.4220; GluA1, Ctrl versus Nestin-Clstn3, p = 0.8297; GluA2, Ctrl versus Nestin-Clstn3, p = 0.6194; GluN1, Ctrl versus Nestin-Clstn3, p = 0.6259; GluN2A, Ctrl versus Nestin-Clstn3, p = 0.4662; GAD67, Ctrl versus Nestin-Clstn3, p = 0.1273; Gephyrin, Ctrl versus Nestin-Clstn3, p = 0.9630; GABAARγ2, Ctrl versus Nestin-Clstn3, p = 0.1533, p values for cortex: Clstn3, Ctrl versus Nestin-Clstn3, p = 0.0005; Clstn1, Ctrl versus Nestin-Clstn3, p = 0.5330; Clstn2, Ctrl versus Nestin-Clstn3, p = 0.7626; VGLUT1, Ctrl versus Nestin-Clstn3, p = 0.6513; PSD-95, Ctrl versus Nestin-Clstn3, p = 0.6915; GluA1, Ctrl versus Nestin-Clstn3, p = 0.0533; GluA2, Ctrl versus Nestin-Clstn3, p = 0.6495; GluN1, Ctrl versus Nestin-Clstn3, p = 0.1727; GluN2A, Ctrl versus Nestin-Clstn3, p = 0.1004; GAD67, Ctrl versus Nestin-Clstn3, p = 0.1180; Gephyrin, Ctrl versus Nestin-Clstn3, p = 0.5918; GABAARγ2, Ctrl versus Nestin-Clstn3, p = 0.8711.

