Figure 9.
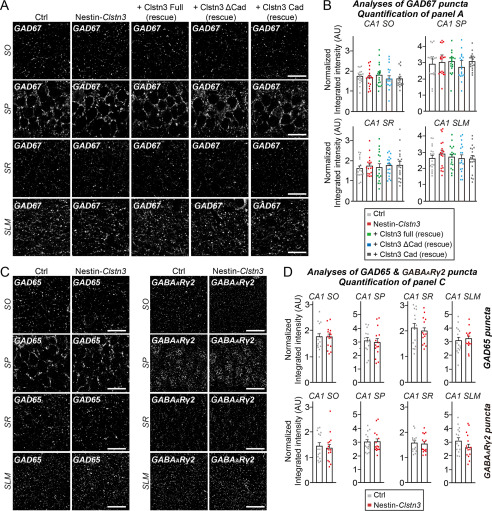
Clstn3 deletion does not affect inhibitory synapse development. A, representative images of hippocampal CA1 SO, SP, SR, and SLM regions 2 weeks after stereotactic injection of the indicated AAVs into Clstn3fl/fl or Nestin-Clstn3 mice, followed by immunostaining for GABAergic synapse marker (GAD67). Scale bar: 20 μm (applies to all images). B, quantification of the integrated intensity of GAD67-positive synaptic puncta. Data are mean ± S.E. (ANOVA with Tukey's test; n = 5 mice each after averaging data from 4-6 sections/mouse). p values for GAD67 in CA1 SO: Ctrl versus Nestin-Clstn3, p = 0.9953; Ctrl versus Clstn3 Full (rescue), p = 0.9909; Ctrl versus Clstn3 ΔCad (rescue), p = 0.9141; Ctrl versus Clstn3 Cad (rescue), p = 0.9036. p values for GAD67 in CA1 SP: Ctrl versus Nestin-Clstn3, p = 0.9848; Ctrl versus Clstn3 Full (rescue), p = 0.9596; Ctrl versus Clstn3 ΔCad (rescue), p = 0.9478; Ctrl versus Clstn3 Cad (rescue), p = 0.9560. p values for GAD67 in CA1 SR: Ctrl versus Nestin-Clstn3, p = 0.9807; Ctrl versus Clstn3 Full (rescue), p > 0.9999; Ctrl versus Clstn3 ΔCad (rescue), p = 0.9837; Ctrl versus Clstn3 Cad (rescue), p = 0.9357. p values for GAD67 in CA1 SLM: Ctrl versus Nestin-Clstn3, p = 0.8416; Ctrl versus Clstn3 Full (rescue), p = 0.9981; Ctrl versus Clstn3 ΔCad (rescue), p > 0.9999; Ctrl versus Clstn3 Cad (rescue), p > 0.9999. C, representative images of hippocampal CA1 SO, SP, SR, and SLM regions in Clstn3fl/fl or Nestin-Clstn3 mice, followed by immunostaining for the indicated GABAergic synapse markers (GAD65 or GABAARγ2). Scale bar: 20 μm (applies to all images). D, quantification of the integrated intensity of GAD65- or GABAARγ2-positive synaptic puncta. Data are mean ± S.E. (nonparametric Kruskal-Wallis test with Dunn's post hoc test; n = 5 mice each after averaging data from 4 to 6 sections/mouse).

