Figure 6.
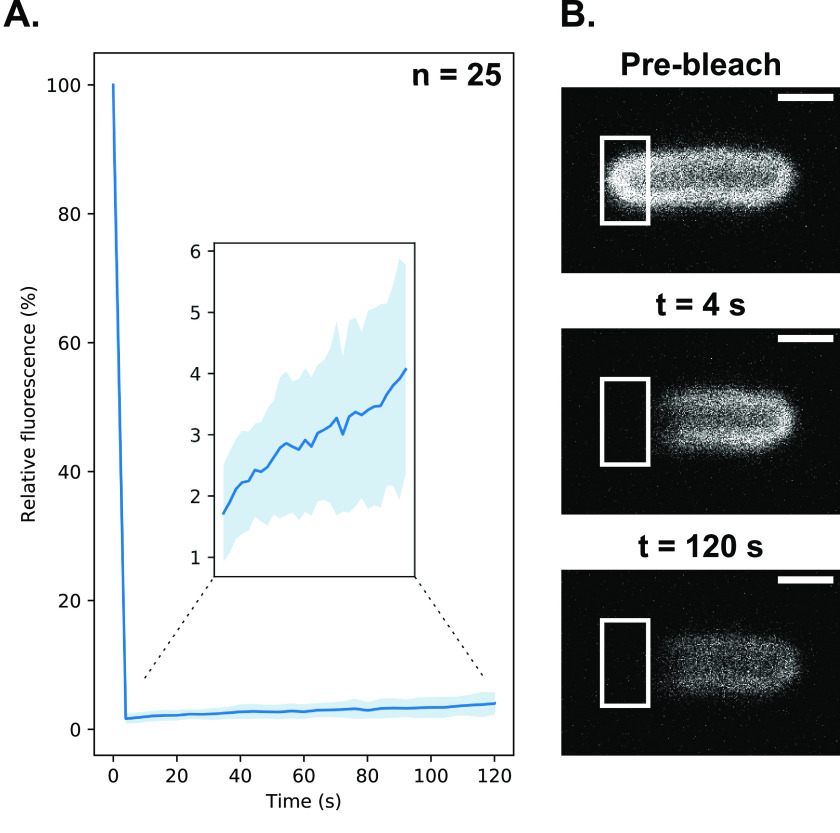
A, fluorescence recovery after photobleaching of OmpF after labeling E. coli BL21(DE3) with ColN1-185-mCherry. The FRAP curve shows the fluorescence recovery over 120 s with imaging conducted every 4 s. After 120 s recovery reached a relative fluorescence value of 4.1 ± 1.7%. Inset, FRAP curve from 4 to 120 s. B, representative images from one FRAP experiment, the bleaching target area is highlighted, all images were contrast adjusted to the same arbitrary level. All scale bars represent a distance of 1 μm.

