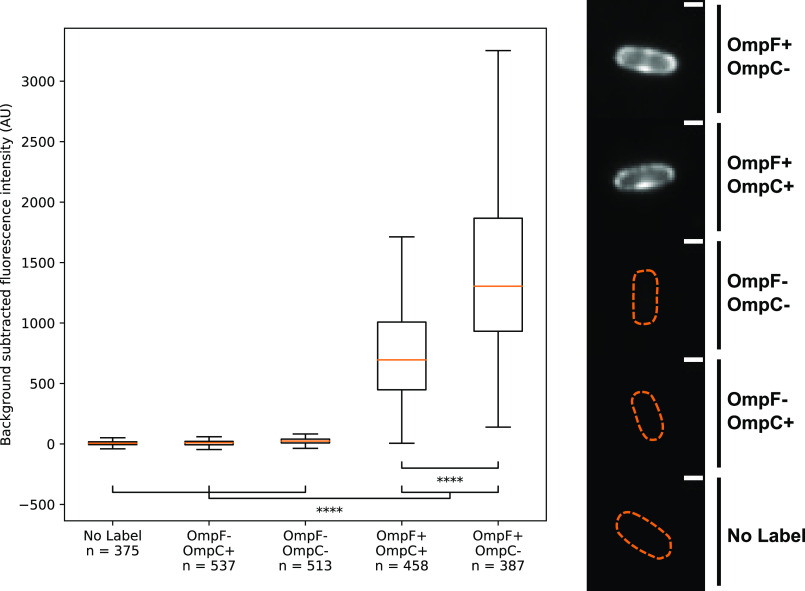
Figure 7.
ColN1-185-mCherry labeling fluorescence quantification. Box and whisker plots showing median fluorescence intensity, upper and lower quartiles, whiskers represent the highest and lowest data points within the upper quartile + 1.5 × the inter quartile range, and the lower quartile −1.5 × the inter quartile range. Strains tested were as follows. No Label, BW25113 untreated; OmpF−, OmpC+, JW0912-1; OmpF−, OmpC−, BZB1107; OmpF+, OmpC+, BW25113; and OmpF+, OmpC−, JW2203-1. Single representative images of cells from each condition tested are displayed (right), the bounds of these cells were determined from transillumination images and these bounds are represented by the orange dashed lines. Cell images were contrast adjusted to the same arbitrary level, all scale bars represent a distance of 1 μm.

