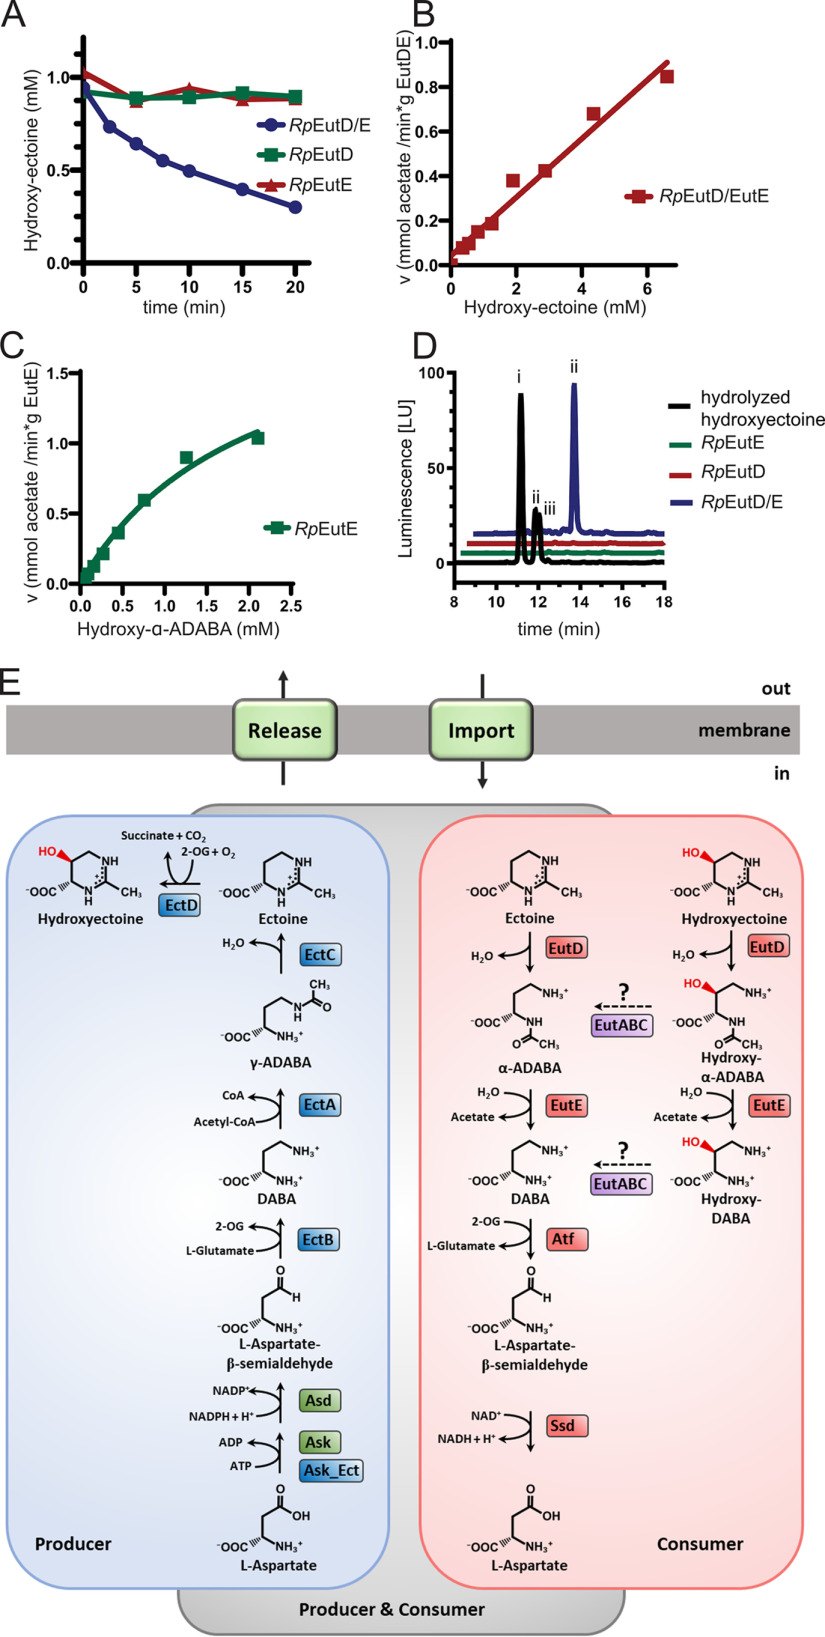
Figure 7.
Microbial ectoine degradation. A, degradation of 5-hydroxyectoine by RpEutD (green), RpEutE (red), and both enzymes together (blue), as monitored by HPLC. B, the velocity of acetate production as a function of 5-hydroxyectoine concentration was measured by the acetate assay. The enzymes do not exhibit a Michaelis-Menten–like behavior, suggesting that one or both enzymes are not ideally suited for degradation of 5-hydroxyectoine. C, Michaelis-Menten plot of RpEutE degrading α-ADABA into DABA and acetate. Estimated kM and Vmax values are 3 mm and 2 mmol/min/g, respectively. D, analysis of hydroxy–α-ADABA and hydroxy–γ-ADABA in E. coli cells producing EutD, EutE, or both proteins grown on hydroxyectoine containing minimal medium with glucose as the sole carbon source. HPLC analysis detects hydroxy–α-ADABA when both enzymes are present (blue). No hydroxy–ADABA is detected in cells expressing either RpEutD or RpEutE (green and red, respectively). A chemically hydrolyzed hydroxyectoine standard (black) shows three peaks for (i) hydroxy–γ-ADABA, (ii) hydroxy–α-ADABA, and (iii) a mixture of both isomers. E, ectoine degradation (red box) can be thought as opposite of its biosynthesis pathway (blue box). Both pathways separate at the respective ADABAs isomers.

