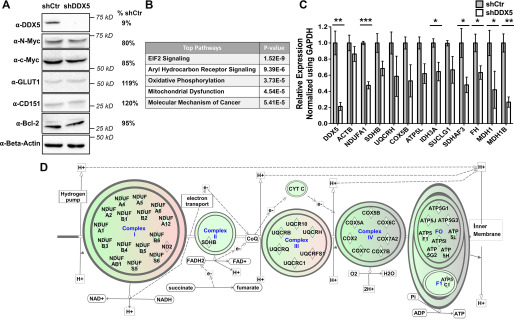
Figure 2.
RNA-Seq reveals dysregulated mitochondrial function upon DDX5 depletion. A, Western blotting of factors known to be involved in SCLC tumorigenesis. H69AR cells with or without DDX5 knockdown were used. GLUT1, glucose transporter type 1; CD151, tetraspanin CD151 molecule; Bcl-2, apoptosis regulator. B, table of the top canonical pathways (from IPA) associated with DEGs upon DDX5 knockdown. Canonical pathways were identified using the Qiagen IPA toolkit. C, independent validation of misregulated mitochondrial function upon depletion of DDX5 using RT-qPCR. Primer sets spanning exon junctions were used to quantify mRNA levels, which were then normalized to the expression levels of the glyceraldehyde-3-phosphate dehydrogenase (GAPDH) mRNA. The relative expression levels of each gene in H69AR + shCtr cells were arbitrarily set to 1. The data represent the means ± S.D. of three biological replicates. *, P < 0.05; **, P < 0.01; ***, P < 0.001. D, schematic depicting down-regulation of genes involved in the OxPhos pathway. DEGs are shown as rhombuses. Green or pink fill in the rhombus indicates down-regulation or up-regulation, respectively. Green background indicates that the pathway is predicated to be down-regulated.

