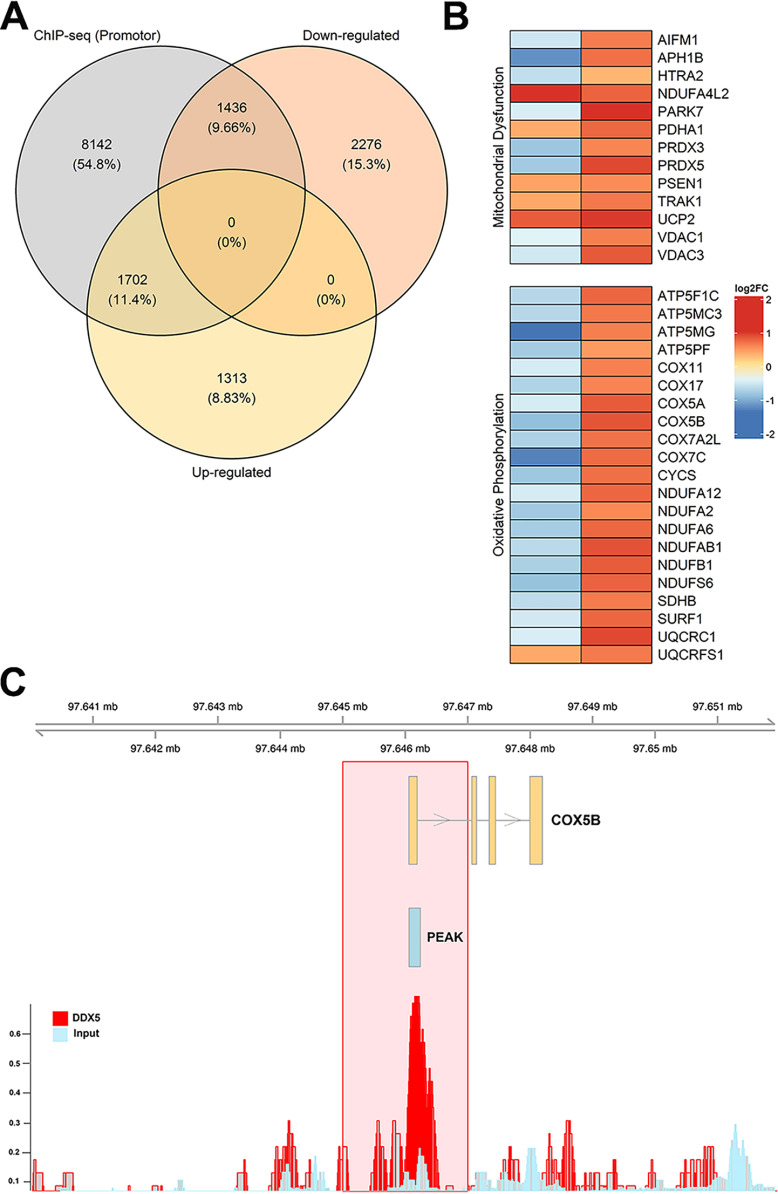
Figure 3.
Differentially expressed genes upon DDX5 knockdown are also bound by DDX5 at promoters. ChIP-Seq data were downloaded from Gene Expression Omnibus (GSE24126), processed, and aligned to the genome. The significance of overlap between DDX5-bound (ChIP-Seq) and DDX5-misregulated (up-regulated or down-regulated) genes was determined using the R-Bioconductor package GeneOverlap (59). Venn diagram, heat map, and genomic visualization figures were generated using the R packages VennDiagram, ComplexHeatmap, and Gviz, respectively (60–62). A, overlap between DDX5-bound (within 1 kb of promoter) and differentially expressed genes from RNA-Seq. B, heat map of selected genes from oxidative phosphorylation and mitochondrial dysfunction pathways with log2 fold change values denoting the direction of gene expression (RNA-Seq, left column) and DDX5-binding strength (ChIP-Seq, right column). C, genomic visualization showing the DDX5-bound peak signal for the gene COX5B.

