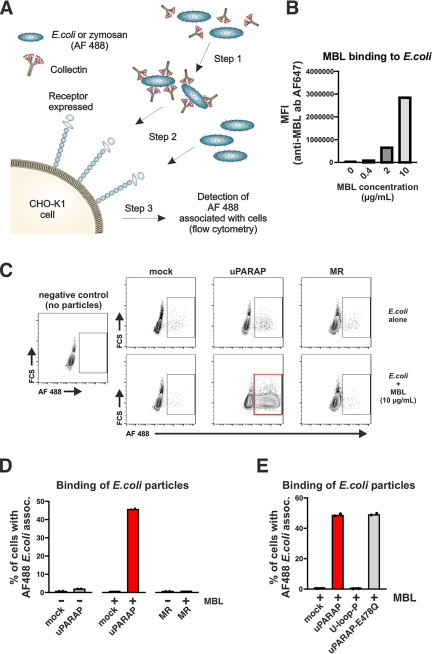
Figure 6.
Interaction of uPARAP with MBL immobilized on the surface of E. coli bioparticles. A, assay for the evaluation of the interaction between cells and surface-bound collectins. Step 1: incubation of AF 488-conjugated bioparticles with collectins. Step 2: incubation of CHO-K1 cells expressing receptor of interest (uPARAP or MR) or mock CHO-K1 cells with bioparticles pre-incubated with collectin. Bioparticles incubated without collectins are also added as a control. Step 3: analysis of fluorescence associated with CHO-K1 cells that were incubated with AF 488-conjugated bioparticles. B, quantification of MBL binding to the surface of E. coli bioparticles. Immobilized MBL was detected using a primary anti-MBL antibody followed by an AF 647-conjugated secondary antibody. The AF 647 signal associated with the bioparticles was quantified using flow cytometry. MFI, mean fluorescence intensity. C and D, assay for the association between AF 488-conjugated E. coli bioparticles and mock-transfected CHO-K1 cells or cells transfected to express uPARAP or MR. Examples of flow charts showing AF 488 fluorescence associated with cells exposed to bioparticles that were preincubated with MBL (C, bottom panels) or incubated without collectin (C, top panels). A negative control sample, in which no bioparticles were added to the cells, is shown in C (left panel). The percentages of cells scoring positive for an association with bioparticles are presented in bar charts (D). E, assay for the association between E. coli bioparticles and mock-transfected CHO-K1 cells or cells transfected to express uPARAP, U-loop-P, or E478Q uPARAP mutant. E. coli bioparticles were preincubated with 10 µg/ml of MBL. Presentation of results in bar charts as in D. Analysis was performed in duplicate. Data are presented as mean with individual data points also shown (D and E).

