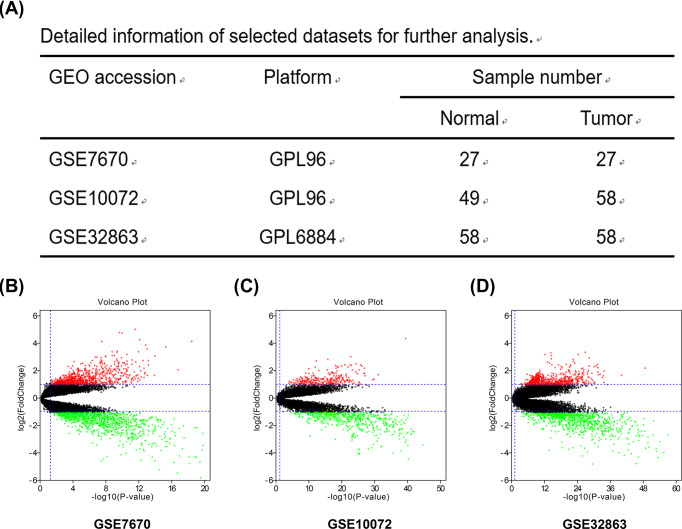
Figure 1. Volcano plots of differentially expressed genes (DEGs) from there datasets (GSE7670, GSE10072 and GSE32863).
(A) The detailed information of three selected datasets for differential expression analysis. (B) DEGs identified in GSE7670 dataset. (C) DEGs identified in GSE10072. (D) DEGs identified in GSE32863. Note: These volcano plots showed all of the DEGs. The black dots represent genes that are not differentially expressed between lung adenocarcinoma tissues and normal lung tissues, and the green dots and red dots represent the down-regulated and up-regulated genes in cancer samples, respectively. Adj. P-value < 0.05 and |log2FC| > 1 were set as the cut-off criteria.

