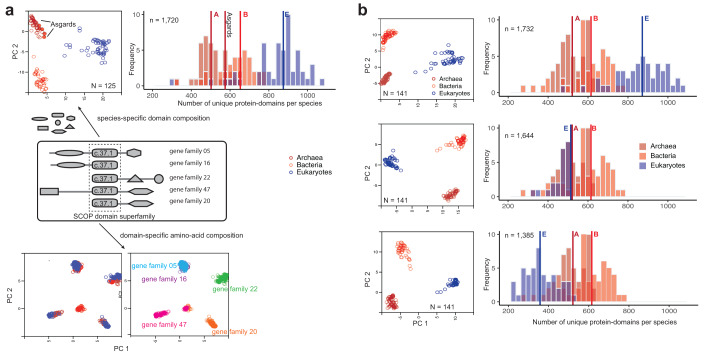
Figure 2. Compositions of unique protein-domains identify with organismal families whereas amino acid compositions of individual domains relate to gene families.
( a) Protein-domains are considered to be independent evolutionary units with a distinct tertiary fold, amino acid sequence and biochemical function. A large proportion of proteins are multi-domain proteins formed by duplication and recombination of domain units. Covariation of protein-domain composition among the 125 species sampled by Williams et al. 7 (top) was compared by principal component analysis (PCA). Each circle in the PCA projection (top left) is a distinct species, defined by a species-specific domain cohort. Asgards are highlighted as filled circles. The frequency distribution (top right) shows the number of distinct protein-domains per species. Vertical intersecting lines in the histograms are the median numbers of protein-domains. Protein domain composition is characteristic of clades of species (top left). In contrast, covariation of amino acid composition (bottom) in a single-domain (super)family is not clade-specific, but instead gene family-specific. Multiple sequence alignments of a single domain (c.37.1) shared by 5/50 concatenated orthologous gene families from 125 species were sampled for the PCA projection. ( b) Effects of severe perturbation of the domain composition in recovering clade-specific distributions was tested in a sample of 141 species. Despite the suspicion that the rooting between akaryotes and eukaryotes could be biased due to a larger domain cohort in eukaryotes 7, it is not the case 2, 3, 12. Diversity of clade-specific domain composition (top right), measured simply as the number of protein domains 4, is a poor descriptor of heterogeneity and can be misleading. Clades are grouped by covarying “protein-domain types”, but not by numbers alone. The rooting is stable, and the tree topology is virtually identical, even after reducing the eukaryote cohort by 1/3rds (middle) or 2/3rds (bottom) 8 of the original composition 7. Descriptions of the PCA projections and frequencies are the same as in ( a).

